cgroups — The Resource Governor
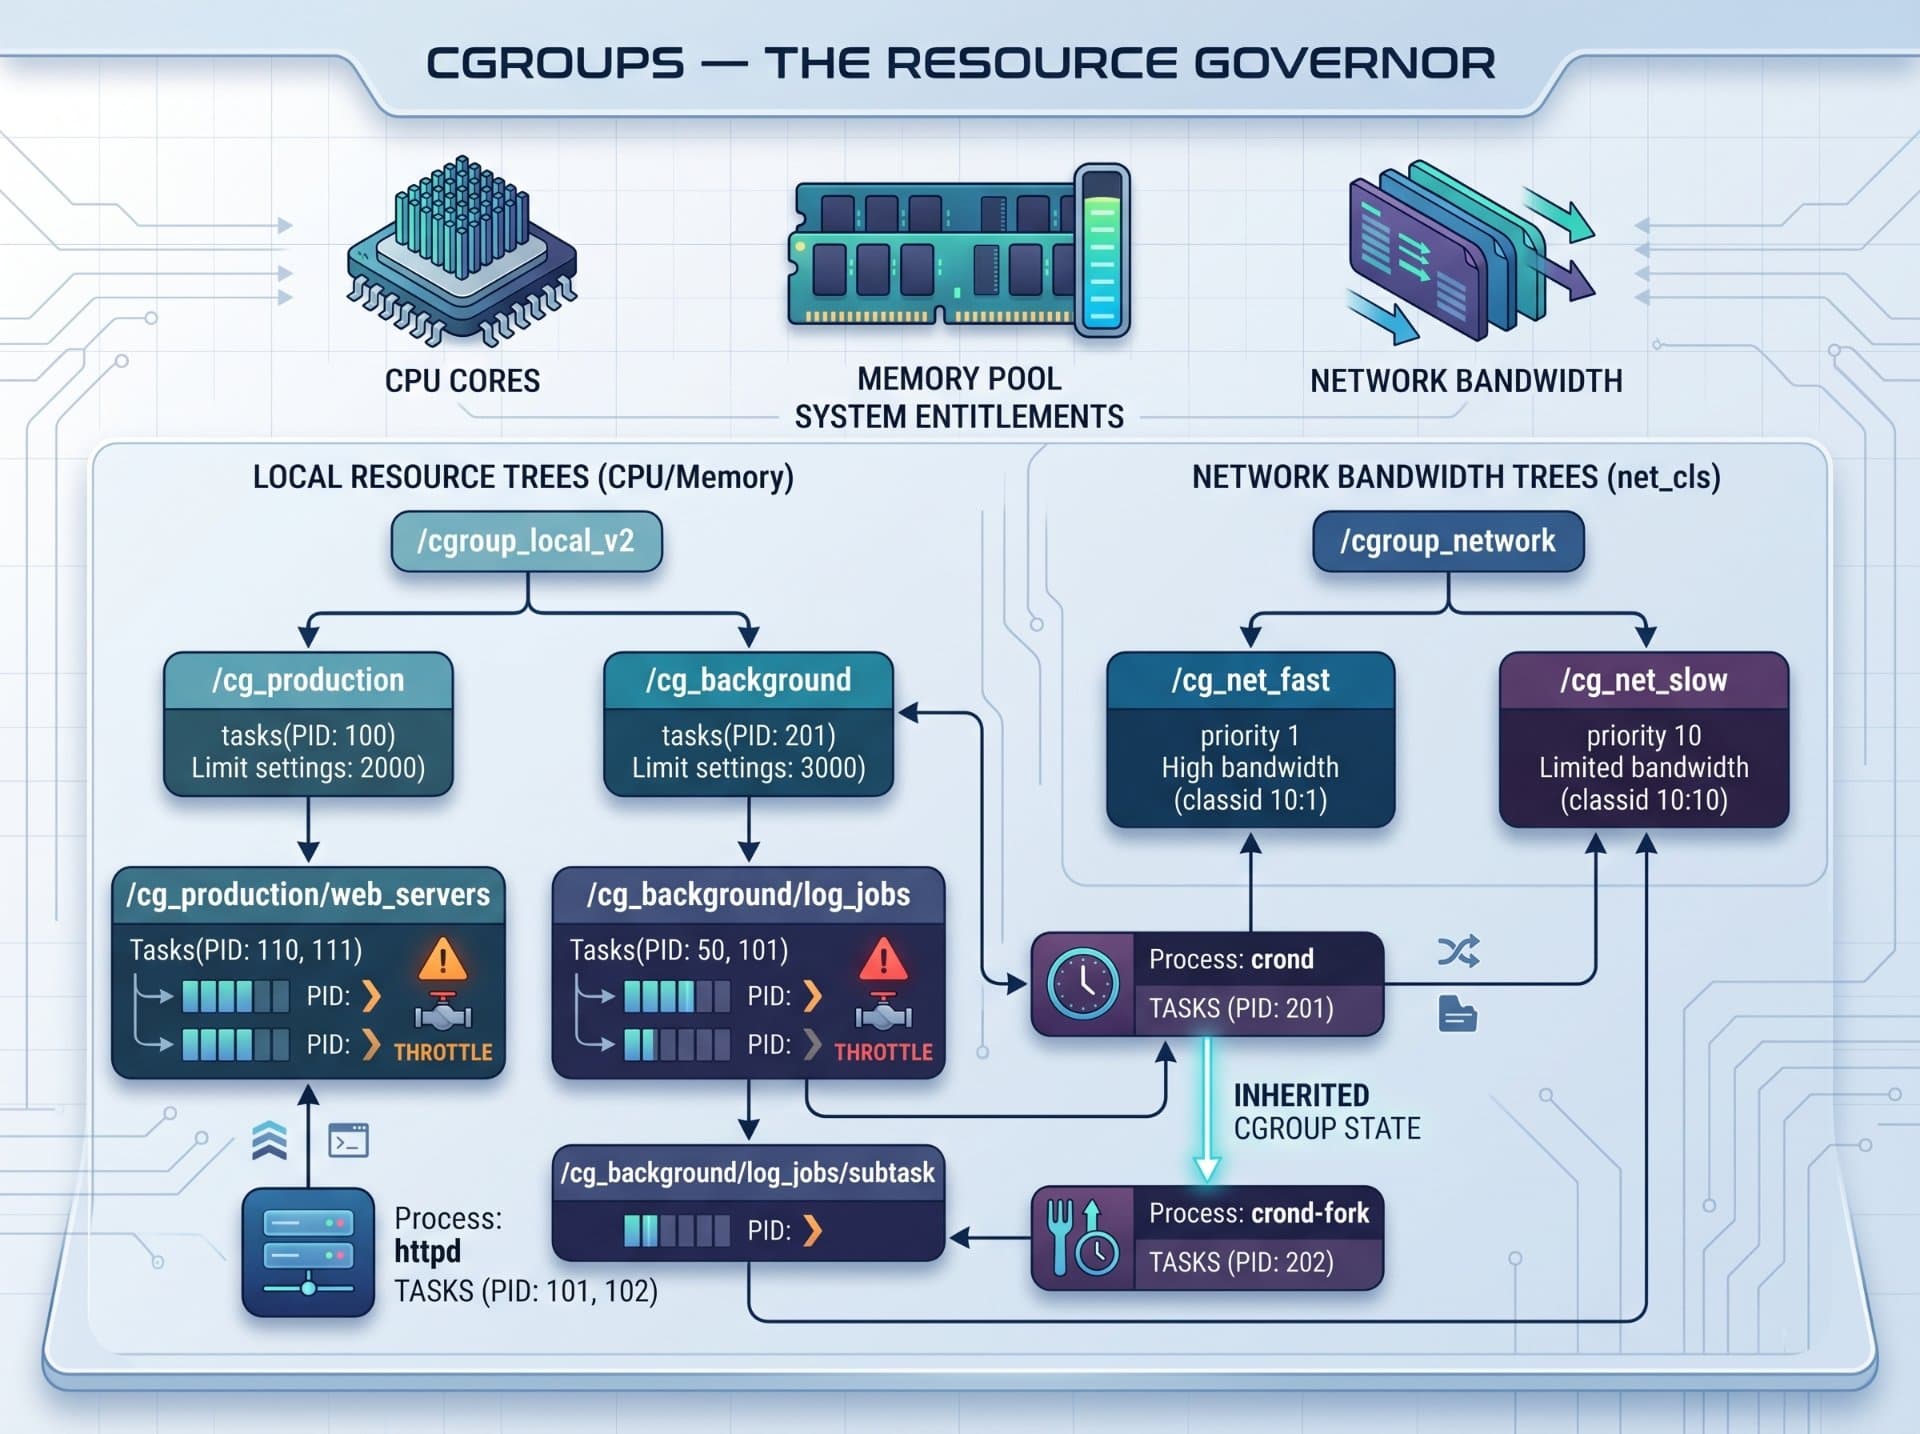
Namespaces build the walls. cgroups control everything that flows through them CPU time, memory, disk I/O, network bandwidth. This is the throttle, the fuel gauge, and the emergency shutoff for every process on Linux.

Advertisements
The problem cgroups solve
In the previous article, we learned that namespaces answer the question: "what can a process see?" They build invisible walls around process lists, network stacks, filesystems, hostnames. But walls alone are not enough. A process inside a perfectly isolated namespace can still consume every byte of RAM, saturate every CPU core, and flood every disk silently starving every other process on the machine.
This is the noisy neighbour problem. Without resource limits, one runaway process a memory leak, an infinite loop, a misbehaving application can take down an entire server. Not by breaking through namespace walls, but by consuming the physical resources that all namespaces share.
The apartment building analogy — continued
We said namespaces are the walls between apartments. Now imagine one tenant running twenty industrial air conditioners simultaneously drawing so much power that the building's electrical system collapses and every other apartment goes dark. The walls kept them isolated. But walls do not control how much electricity, water, or gas each apartment can consume. cgroups are the utility meters and the circuit breakers they ensure no single tenant can monopolise the building's shared resources, no matter what they do inside their own walls.
cgroups: Control Groups were introduced into the Linux kernel in 2008 by Google engineers who needed a way to guarantee resource isolation for their internal workloads. Today they are the foundation of every container runtime, every cloud virtualisation system, and every multi-tenant Linux environment in existence.
The one-sentence definition: A cgroup is a kernel mechanism that groups processes together so that resource limits, accounting, and controls can be applied to the group as a whole enforced by the kernel at every scheduling cycle, automatically, with no cooperation from the processes inside.
What a cgroup actually is
A cgroup is not a configuration file. It is not a daemon. It is a kernel data structure a group of processes linked together in the kernel's internal tracking tables, with a set of resource controllers attached to them. And crucially, cgroups are exposed to userspace through a virtual filesystem mounted at /sys/fs/cgroup/.
This is the key insight: every cgroup limit is just a file. To set a memory limit of 512 MB, you write the number 536870912 into a file. The kernel reads that file on every memory allocation attempt. No daemon. No API call. Just a file write. The simplicity is breathtaking.
# The cgroup virtual filesystem lives here
ls /sys/fs/cgroup/
cgroup.controllers  cgroup.procs  cpu.stat  memory.stat
memory.max          memory.current  cpu.max  io.max ...

# Every process already belongs to a cgroup — check your shell
cat /proc/self/cgroup
0::/user.slice/user-1000.slice/session-3.scope

# Create a new cgroup — just make a directory
sudo mkdir /sys/fs/cgroup/myapp

# The kernel automatically populates it with control files
ls /sys/fs/cgroup/myapp/
cgroup.controllers  cgroup.events   cgroup.freeze
cgroup.max.depth    cgroup.procs    cgroup.stat
cgroup.subtree_control              cgroup.threads
cpu.max             cpu.stat        cpu.weight
io.max              io.stat         memory.current
memory.max          memory.min      memory.swap.max

# Set a 256 MB memory limit — just write a number to a file
echo 268435456 | sudo tee /sys/fs/cgroup/myapp/memory.max
268435456

# Move your current shell into this cgroup
echo $$ | sudo tee /sys/fs/cgroup/myapp/cgroup.procs

# Now your shell — and every child process it spawns —
# is limited to 256 MB of memory. No restart needed.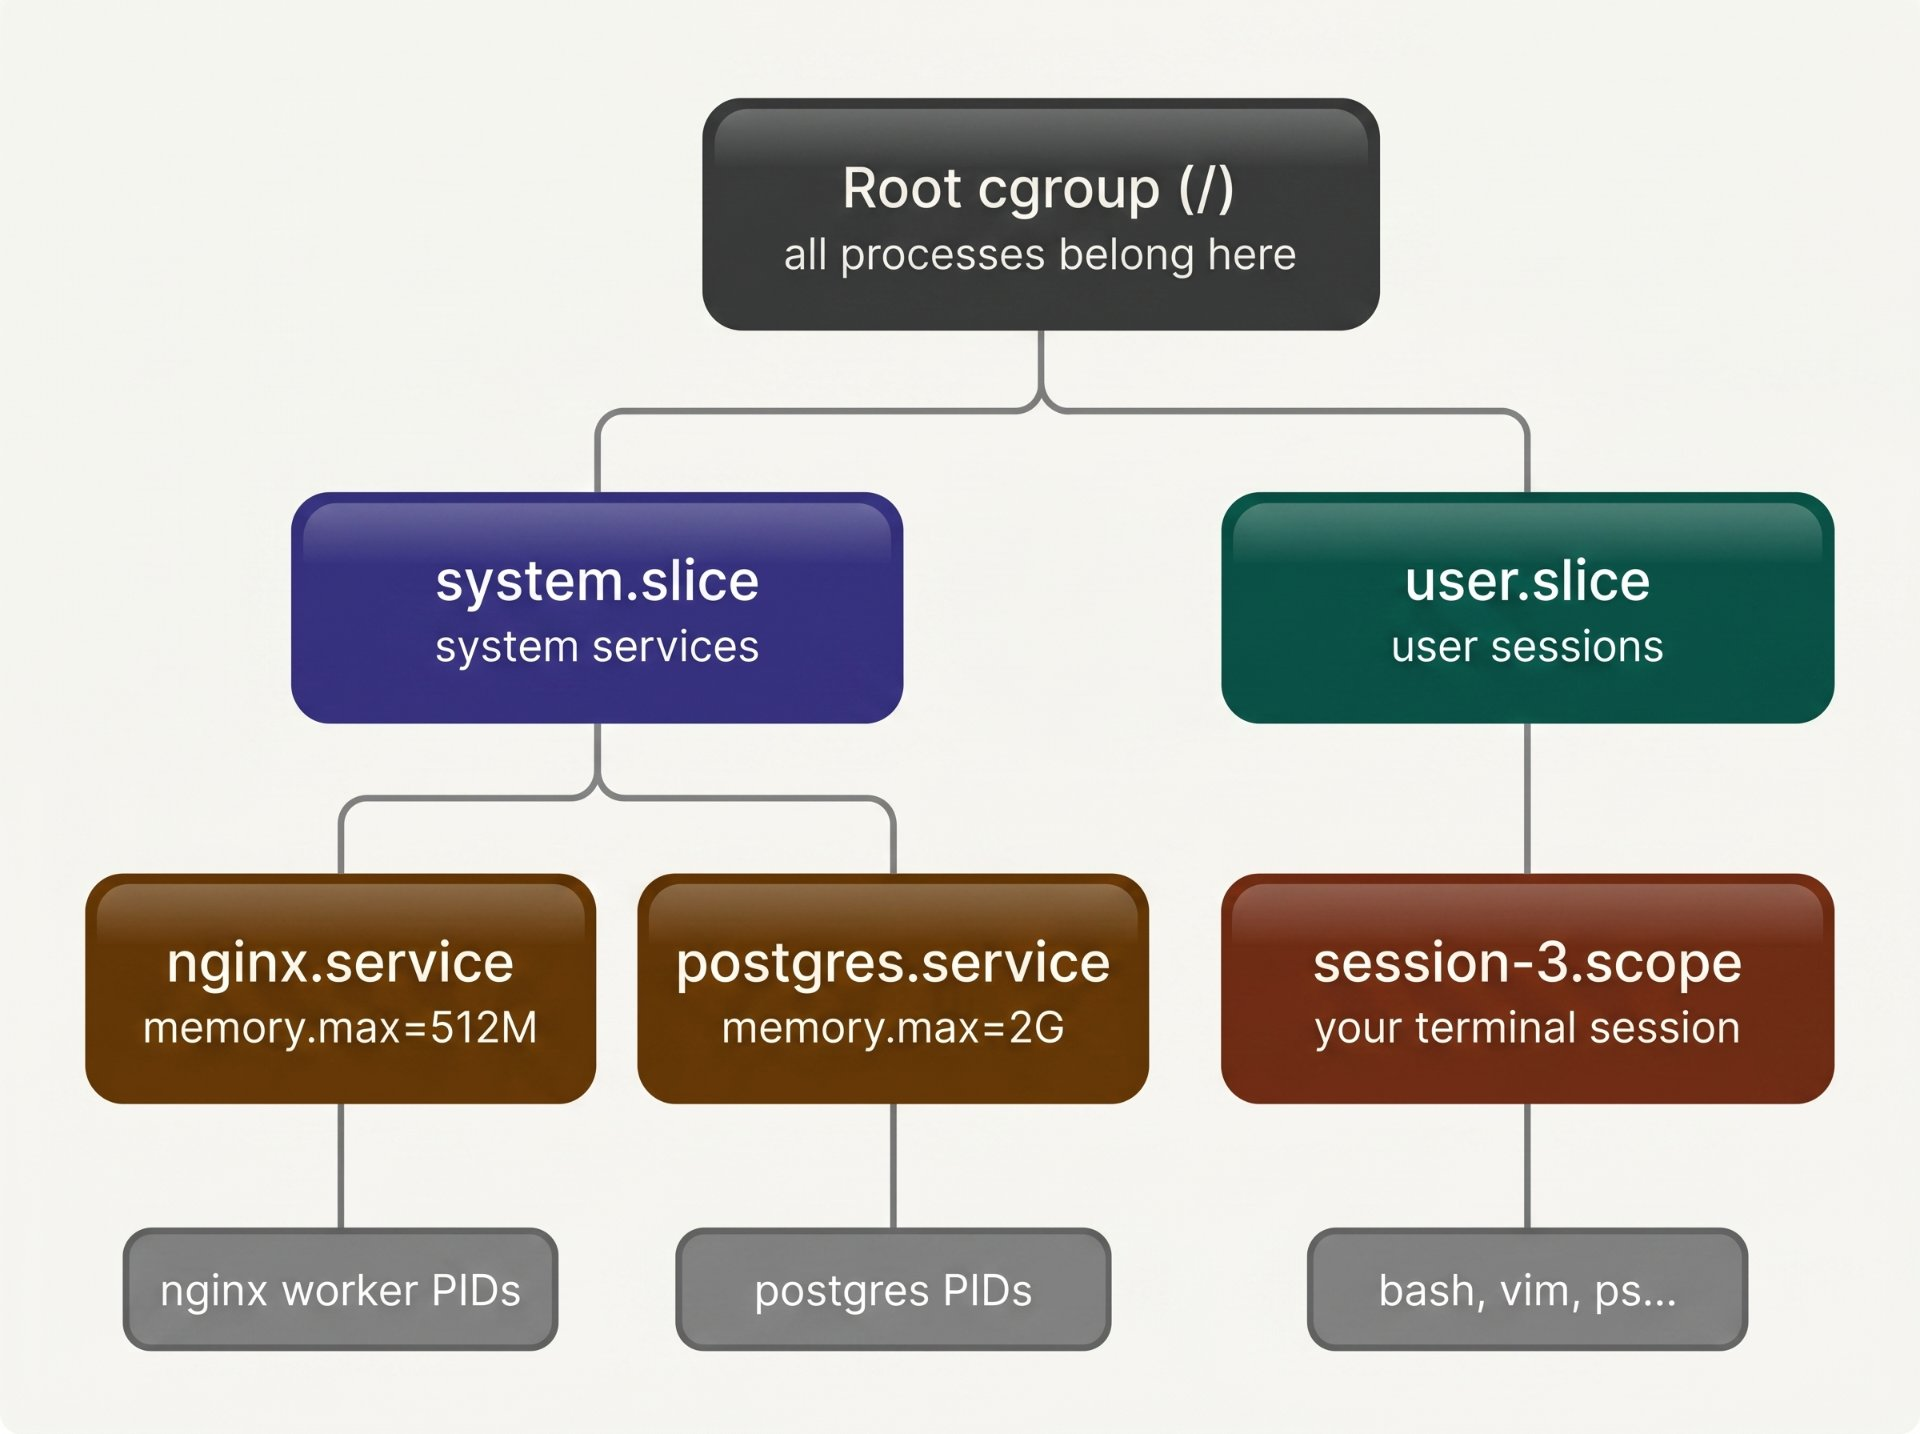
The cgroup hierarchy on a typical systemd machine. Every process lives in a leaf cgroup. Limits cascade: a limit set on system.slice caps the total resources available to all its children combined.
The cgroup hierarchy — a tree of limits
cgroups are organised as a tree. The root cgroup contains all processes on the machine. Below it, child cgroups can be created, each containing a subset of processes. Limits set on a parent automatically cap the total resources available to all its children. a child can never exceed its parent's limit, regardless of its own setting.
The corporate budget analogy
A company has a total budget of £10 million. It allocates £4 million to Engineering, £3 million to Sales, and £3 million to Operations. Within Engineering, the budget is split further: £2 million for Backend, £1 million for Frontend, £1 million for DevOps. No matter what the Backend team does, they cannot spend more than £2 million and the Engineering department as a whole cannot spend more than £4 million, even if other departments have spare budget. cgroup hierarchy limits work identically: a child cgroup can set its own limit, but the effective limit is always min(child_limit, parent_limit).
The cascade rule
Limits are enforced top-down. If system.slice has a memory limit of 4 GB, and nginx.service inside it has a memory limit of 512 MB nginx is limited to 512 MB. But if every service inside system.slice tries to use 1 GB simultaneously, they collectively hit the 4 GB ceiling even if each individual limit was not reached. The parent is the ultimate arbiter.
cgroups v1 vs v2 — what changed and why it matters
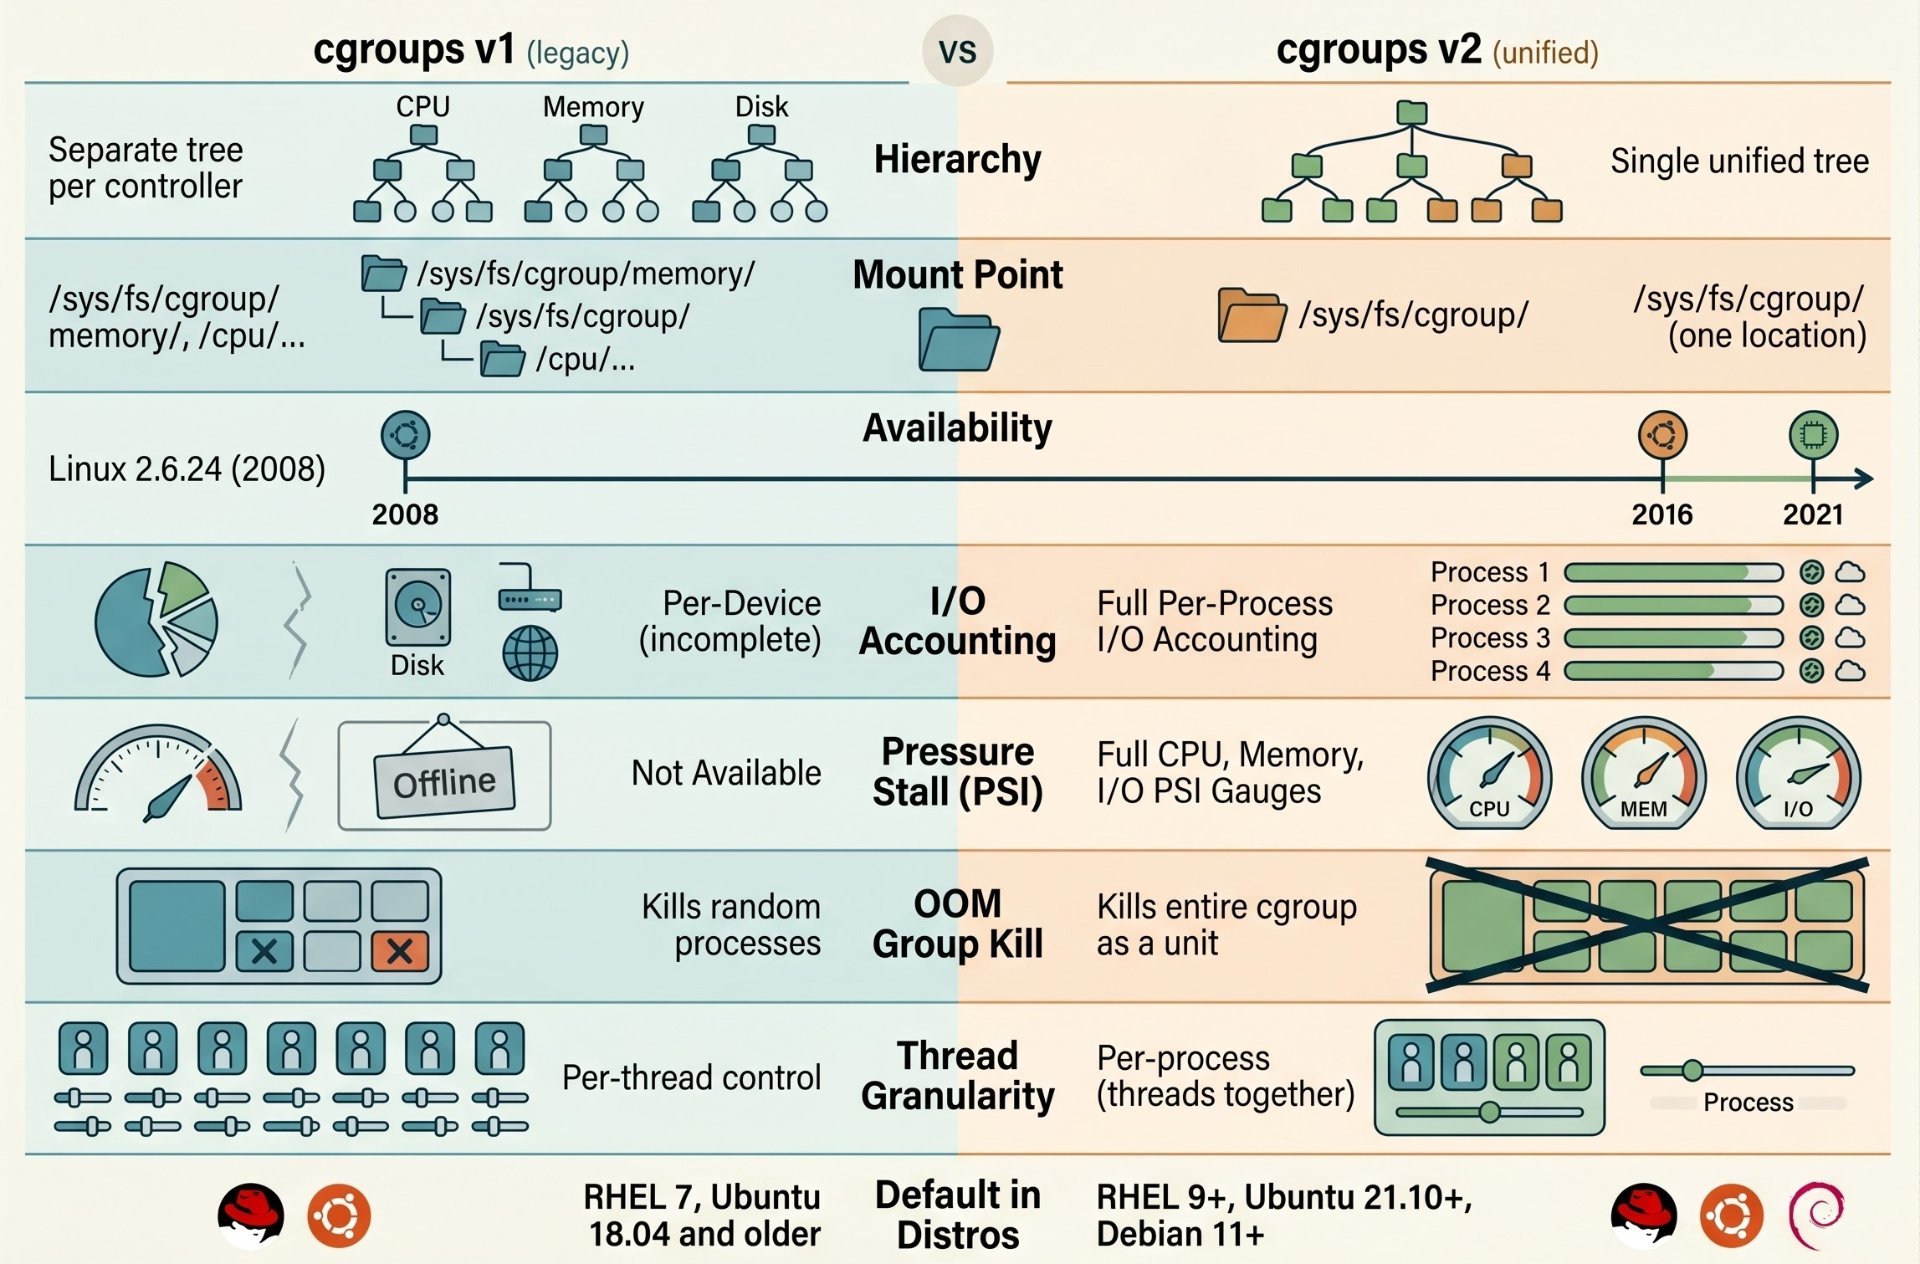
There are two versions of the cgroup interface, and understanding the difference matters when you read kernel documentation, configure systems, or debug resource issues.
# Check if cgroups v2 is active (unified hierarchy)
mount | grep cgroup
cgroup2 on /sys/fs/cgroup type cgroup2 (rw,nosuid,...)
# If you see "cgroup2" → you are on v2 (unified)
# If you see many "cgroup" lines for cpu, memory, etc → v1

# Definitive check
cat /proc/filesystems | grep cgroup
nodev   cgroup
nodev   cgroup2

# See the cgroup type your process uses
cat /proc/self/cgroup
0::/user.slice/user-1000.slice/session-3.scope
# Single line starting with "0::" = cgroups v2
# Multiple lines (12::, 11::, 10::...) = cgroups v1
All examples in the rest of this article use cgroups v2 — the unified hierarchy, which is the default on all modern Linux distributions since 2021. If you are on an older system, the concepts are identical but the paths and file names differ.
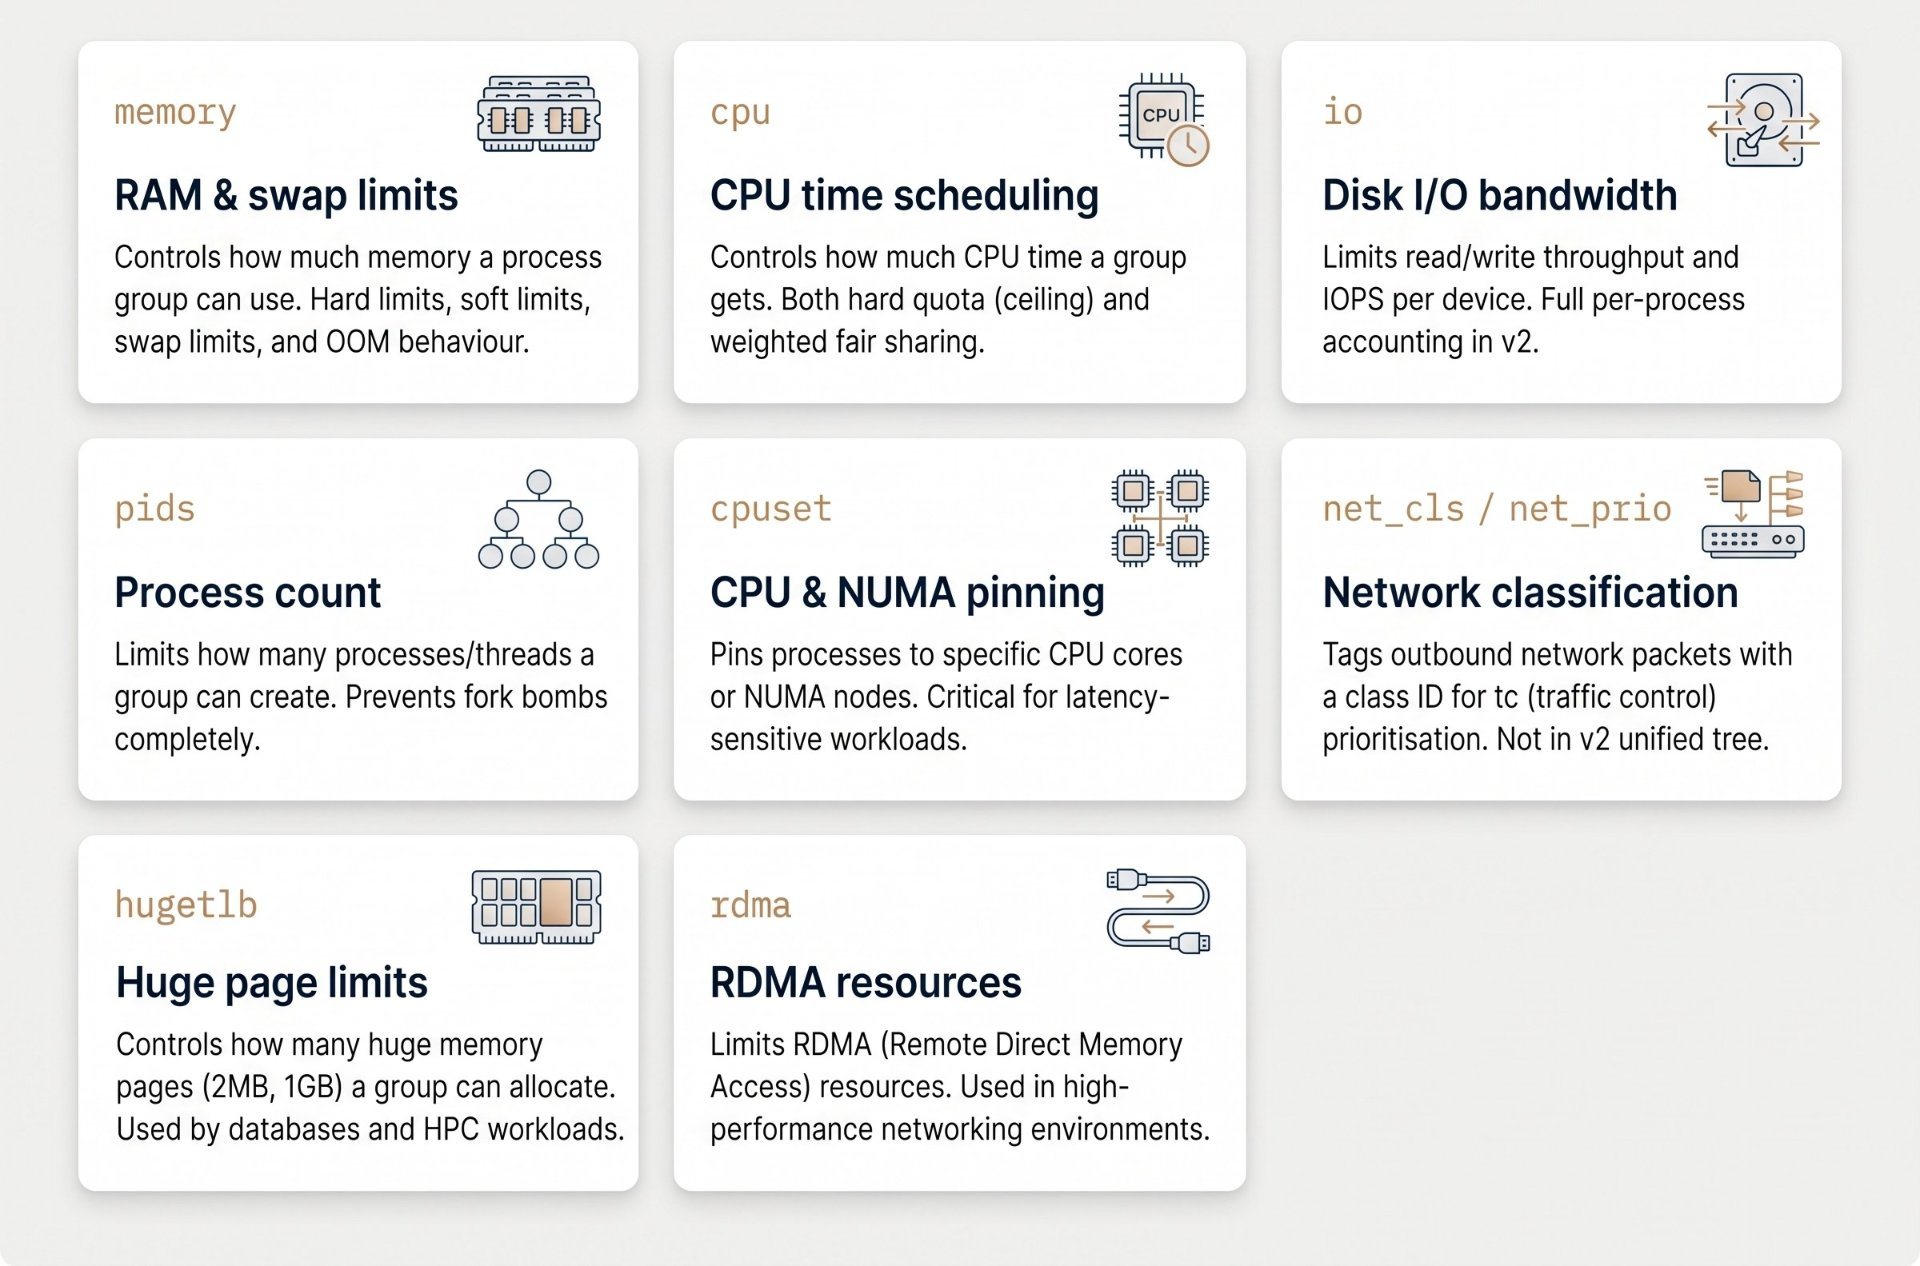
The controllers — what each one governs
A controller (also called a subsystem) is a kernel module that implements resource accounting and limiting for one type of resource. Think of each controller as a specialist: the memory controller handles RAM, the CPU controller handles processing time, the I/O controller handles disk access.
# See which controllers are available on your system
cat /sys/fs/cgroup/cgroup.controllers
cpuset cpu io memory hugetlb pids rdma misc

# See which controllers are active for a cgroup's children
cat /sys/fs/cgroup/cgroup.subtree_control
cpu io memory pids

# Enable a controller for your custom cgroup's children
# (must be enabled in parent first — cascades down)
echo "+memory +cpu +io +pids" | sudo tee /sys/fs/cgroup/myapp/cgroup.subtree_controlMemory controller deep dive
The memory controller is the most consequential of all controllers. Running out of memory is one of the most common and catastrophic failure modes in production systems. The memory controller gives you precise, enforceable control over how much RAM a group of processes can use.
The water tank analogy
Imagine each process group has a water tank. The memory controller defines the tank's size. Water flowing in is memory being allocated. When the tank is full, one of two things happens: either the process pauses and waits for water to drain out (caching eviction), or if it truly cannot continue without more water the OOM killer kicks in and drains the tank by force, terminating the thirstiest process. The tank size is memory.max. The "soft warning" level is memory.high. The minimum guaranteed amount is memory.min.
# ── memory.min ────────────────────────────────────────────────
# Guaranteed memory that will NEVER be reclaimed from this cgroup
# even when the system is under pressure. Think: reserved seating.
echo 134217728 | sudo tee /sys/fs/cgroup/myapp/memory.min
# 128 MB guaranteed — kernel will not reclaim below this

# ── memory.low ────────────────────────────────────────────────
# Soft protection: kernel avoids reclaiming below this,
# but will if the system is critically low.
echo 268435456 | sudo tee /sys/fs/cgroup/myapp/memory.low
# 256 MB soft floor

# ── memory.high ───────────────────────────────────────────────
# Soft ceiling: when exceeded, kernel throttles allocations
# and aggressively reclaims. The process slows but doesn't die.
echo 402653184 | sudo tee /sys/fs/cgroup/myapp/memory.high
# 384 MB — exceed this and you start getting throttled

# ── memory.max ────────────────────────────────────────────────
# Hard ceiling: allocations above this FAIL.
# The OOM killer triggers to free memory.
echo 536870912 | sudo tee /sys/fs/cgroup/myapp/memory.max
# 512 MB hard limit — OOM kill if exceeded

# ── memory.swap.max ───────────────────────────────────────────
# Limits swap usage. Set to 0 to disable swap for this cgroup.
echo 0 | sudo tee /sys/fs/cgroup/myapp/memory.swap.max
# No swap — OOM kill immediately when memory.max is hit

# ── Read current usage ────────────────────────────────────────
cat /sys/fs/cgroup/myapp/memory.current
182452224   # 174 MB currently in use

cat /sys/fs/cgroup/myapp/memory.peak
387284992   # 369 MB peak since cgroup was created
memory.high vs memory.max — the critical difference
memory.high is a soft limit that throttles the process it slows allocations and triggers aggressive cache eviction, but the process survives. memory.max is a hard limit that triggers the OOM killer processes die. In production, set memory.high to about 80% of your intended limit to give the kernel time to reclaim gracefully before hitting the hard wall at memory.max. This way you get a warning (via PSI, covered later) before the process actually dies.
# memory.stat breaks down memory usage by category
cat /sys/fs/cgroup/myapp/memory.stat

anon              104857600   # 100 MB heap/stack (your app's data)
file              83886080    # 80 MB page cache (files read into memory)
kernel_stack      1048576     # kernel stack for threads
slab              10485760    # kernel slab allocator memory
sock              524288      # memory used by sockets
pgfault           12450       # minor page faults (normal)
pgmajfault        3           # major page faults — disk I/O needed

# KEY DEBUGGING TIP:
# If memory.current is high but 'anon' is low, it's page cache
# (the kernel cached files you read — not a real leak)
# If 'anon' is climbing steadily — that is a genuine memory leakCPU controller deep dive
The CPU controller is the most nuanced of all controllers because it offers two completely different models of resource control: a hard quota (a ceiling that the process can never exceed) and weighted fair sharing (a relative priority that determines how the CPU is shared when there is contention).
The office printer analogy
Imagine an office with one printer shared by five teams. Weighted fair sharing is like giving each team a priority score the team with score 200 gets twice as many print slots as the team with score 100, when everyone is competing. But if only one team is printing, they get the whole printer. Hard quota (cpu.max) is different it is like a physical timer that cuts off any team's print job after exactly 30 seconds per minute, regardless of whether anyone else wants to print. Quota guarantees a ceiling; weight governs fairness during contention.
# ── cpu.max — hard quota ──────────────────────────────────────
# Format: "quota_microseconds period_microseconds"
# This means: use at most 150ms of CPU per 100ms period = 1.5 CPUs
echo "150000 100000" | sudo tee /sys/fs/cgroup/myapp/cpu.max

# Use 50% of one CPU (50ms per 100ms)
echo "50000 100000" | sudo tee /sys/fs/cgroup/myapp/cpu.max

# Remove the quota entirely (unlimited)
echo "max 100000" | sudo tee /sys/fs/cgroup/myapp/cpu.max

# ── cpu.weight — weighted fair sharing ───────────────────────
# Range: 1-10000, default 100
# A cgroup with weight 200 gets 2x the CPU of weight 100
# when BOTH are competing. If only one runs, it gets 100%.
echo 200 | sudo tee /sys/fs/cgroup/myapp/cpu.weight   # high priority
echo 50  | sudo tee /sys/fs/cgroup/batch/cpu.weight   # low priority batch

# ── cpu.stat — was the cgroup being throttled? ────────────────
cat /sys/fs/cgroup/myapp/cpu.stat

usage_usec          45230194   # total CPU time used
user_usec           38194820   # time in user space
system_usec          7035374   # time in kernel
nr_periods              4523   # scheduling periods elapsed
nr_throttled            1847   # periods where quota was exhausted ← key
throttled_usec     184700000   # total time spent throttled ← key

# High nr_throttled = your cpu.max quota is too low
# The process is being held back — it wants more CPU than allowed
The CPU throttling trap in containers
High CPU throttling is one of the most common and invisible performance problems in containerised environments. A container set to "1 CPU" with cpu.max=100000 100000 can be throttled even when the host has spare CPU capacity because the quota is enforced per-period, not just when the system is busy. Check nr_throttled and throttled_usec regularly. If throttling is significant, raise the quota or switch to weight-based sharing instead.
I/O controller deep dive
The I/O controller limits how much disk bandwidth and how many I/O operations per second a process group can consume. Without it, one process doing intensive disk writes can saturate the I/O subsystem and make every other process on the machine wait for disk access.
# Find the major:minor device numbers for your disk
ls -l /dev/sda
brw-rw---- 1 root disk 8, 0 /dev/sda
# Major=8, Minor=0 → use "8:0" in io.max

# io.max — hard limits per device
# Format: "MAJOR:MINOR rbps=N wbps=N riops=N wiops=N"

# Limit reads to 50 MB/s and writes to 20 MB/s on /dev/sda
echo "8:0 rbps=52428800 wbps=20971520" | \
  sudo tee /sys/fs/cgroup/myapp/io.max

# Limit IOPS (I/O operations per second)
echo "8:0 riops=1000 wiops=500" | \
  sudo tee /sys/fs/cgroup/myapp/io.max

# Combine throughput AND IOPS limits
echo "8:0 rbps=52428800 wbps=20971520 riops=1000 wiops=500" | \
  sudo tee /sys/fs/cgroup/myapp/io.max

# io.weight — relative priority (like cpu.weight)
echo "8:0 100" | sudo tee /sys/fs/cgroup/myapp/io.weight

# Read actual I/O stats
cat /sys/fs/cgroup/myapp/io.stat
8:0 rbytes=104857600 wbytes=20971520 rios=1024 wios=512
dbytes=0 dios=0Creating and using cgroups — end to end
# ── 1. Create the cgroup ──────────────────────────────────────
sudo mkdir /sys/fs/cgroup/myapp

# ── 2. Enable controllers ────────────────────────────────────
echo "+memory +cpu +pids" | \
  sudo tee /sys/fs/cgroup/cgroup.subtree_control

# ── 3. Set limits ────────────────────────────────────────────
# Memory: 256 MB hard limit, 200 MB soft limit
echo 268435456 | sudo tee /sys/fs/cgroup/myapp/memory.max
echo 209715200 | sudo tee /sys/fs/cgroup/myapp/memory.high

# CPU: max 1 CPU (100ms per 100ms period)
echo "100000 100000" | sudo tee /sys/fs/cgroup/myapp/cpu.max

# PIDs: max 50 processes total (prevents fork bombs)
echo 50 | sudo tee /sys/fs/cgroup/myapp/pids.max

# ── 4. Move a process into the cgroup ────────────────────────
# Start your application
./myapp &
APP_PID=$!

# Move it — all future children inherit this cgroup
echo $APP_PID | sudo tee /sys/fs/cgroup/myapp/cgroup.procs

# ── 5. Monitor in real time ──────────────────────────────────
watch -n 1 'echo "=== Memory ===" && \
  cat /sys/fs/cgroup/myapp/memory.current && \
  echo "=== CPU ===" && \
  cat /sys/fs/cgroup/myapp/cpu.stat | grep throttled && \
  echo "=== PIDs ===" && \
  cat /sys/fs/cgroup/myapp/pids.current'

# ── 6. Clean up — processes must exit first ──────────────────
kill $APP_PID
wait $APP_PID
sudo rmdir /sys/fs/cgroup/myappThe OOM killer — Linux's emergency shutoff
When a process group hits its memory.max limit and cannot free memory by evicting cache, the Linux kernel's Out-Of-Memory (OOM) killer activates. It selects a process to terminate freeing its memory to allow the system to continue. This is not a crash. This is a deliberate kernel decision. And in cgroups v2, it kills the entire cgroup as a unit, not random processes.
The lifeboat analogy
A ship is sinking. The lifeboats have a maximum weight capacity. When a lifeboat is overloaded, the crew must make the terrible decision to remove someone not because of any wrongdoing, but because the alternative is everyone drowning. The OOM killer is that decision made by the kernel: one process (or cgroup) dies so that all other processes on the system can survive. The OOM score is the "who should we remove" calculation processes that use the most memory and are least important to system stability score highest.
# Detect an OOM kill from the kernel ring buffer
sudo dmesg | grep -i "oom\|killed process" | tail -10
[ 8432.1] Out of memory: Kill process 12345 (myapp) score 987 or sacrifice child
[ 8432.1] Killed process 12345 (myapp) total-vm:524288kB, anon-rss:262144kB

# Or via journald
sudo journalctl -k | grep -i "out of memory" | tail -5

# OOM score — higher = more likely to be killed
# Range: -1000 (never kill) to 1000 (kill first)
cat /proc/$APP_PID/oom_score
487

# Adjust the OOM score for a process (requires root)
# Lower = protect from OOM killer
echo -500 | sudo tee /proc/$APP_PID/oom_score_adj
# +500 = sacrifice this process first when memory is tight

# cgroups v2: kill the ENTIRE cgroup on OOM (not random processes)
echo 1 | sudo tee /sys/fs/cgroup/myapp/memory.oom.group
# Now if any process in myapp exceeds memory.max,
# the ENTIRE cgroup is killed as a unit — predictable behaviour
Exit code 137 = OOM killed
When a process is OOM killed, it exits with code 137 (128 + signal 9, SIGKILL). If you see exit code 137 in logs and the process did not call exit() or receive SIGTERM the kernel killed it for exceeding its memory limit. Check dmesg immediately. The OOM kill message includes exactly which process was killed, how much memory it was using, and what the system state was at the moment of kill.
Pressure Stall Information — the early warning system
PSI (Pressure Stall Information), introduced in Linux 4.20 and a cgroups v2 feature, answers a question that was previously impossible to answer reliably: how much is this workload suffering due to resource contention? Not "is the CPU busy?" that tells you about utilisation. But "are tasks being delayed because resources are unavailable?" that is pressure.
# Memory pressure for your cgroup
cat /sys/fs/cgroup/myapp/memory.pressure

some avg10=0.00  avg60=0.42  avg300=0.18  total=4832109
full avg10=0.00  avg60=0.11  avg300=0.04  total=1024512

# "some" = at least one task was stalled waiting for memory
# "full" = ALL tasks were stalled (everyone waiting)
# avg10/60/300 = rolling average over 10s, 60s, 300s (like load avg)
# Values are percentages: 0.42 = 0.42% of time tasks were stalled

# CPU pressure
cat /sys/fs/cgroup/myapp/cpu.pressure
some avg10=15.23 avg60=8.45  avg300=4.12  total=845302
# 15% of the last 10 seconds, tasks were waiting for CPU
# This is high — workload is CPU-constrained

# I/O pressure
cat /sys/fs/cgroup/myapp/io.pressure
some avg10=2.14  avg60=0.83  avg300=0.22  total=214532

# Use PSI to trigger actions — e.g. alert when memory pressure spikes
# Write a threshold to memory.pressure to get an epoll notification
# (used by systemd-oomd, earlyoom, and cloud providers for
#  proactive memory management before the OOM killer triggers)
PSI vs traditional metrics
Traditional metrics like CPU% tell you about utilisation — how busy the resource is. PSI tells you about impact how much work is being delayed. A system at 80% CPU utilisation might have 0% CPU pressure if tasks never have to wait. A system at 40% utilisation might have 30% CPU pressure if many small tasks are constantly queued. PSI is what Google, Meta, and systemd use for intelligent resource management it is the most actionable resource metric available in Linux today.
cgroups and containers — the complete picture
When you run docker run --memory 512m --cpus 1.5 myapp, Docker translates those flags into exactly the cgroup operations we have covered in this article. No magic. It creates a cgroup under /sys/fs/cgroup/system.slice/docker-{id}.scope/, writes your limits to the appropriate files, and moves the container's PID into cgroup.procs. The kernel does the rest.
# Find your container's cgroup path
CONTAINER_ID=abc123def456
CGROUP_PATH=$(find /sys/fs/cgroup -name "docker-${CONTAINER_ID}*" -type d 2>/dev/null)

# Read the actual limits the runtime set
cat $CGROUP_PATH/memory.max
536870912   # 512 MB — exactly what --memory 512m set

cat $CGROUP_PATH/cpu.max
150000 100000   # 1.5 CPUs — exactly what --cpus 1.5 set

cat $CGROUP_PATH/pids.max
4194304   # default PID limit Docker sets

# Live memory usage of a running container
cat $CGROUP_PATH/memory.current
182452224   # 174 MB currently used

# CPU throttling — is your container hitting its CPU limit?
cat $CGROUP_PATH/cpu.stat | grep throttled
nr_throttled    1847
throttled_usec  184700000
# If nr_throttled is high, your --cpus limit is too low
The complete picture: a container is a process with namespaces applied (what it can see) and a cgroup applied (what it can consume). Namespaces answer the isolation question. cgroups answer the resource question. Together, they are the entire kernel foundation of every container in existence from the smallest Docker container to the largest Kubernetes pod running Google's production workloads.
Author's Note
Chamath P.
DevOps Engineer
DevOps Engineer writing practical guides on Kubernetes, CI/CD, IaC, and SRE — based on real production experience.
This article was written with AI assistance. All technical claims and code examples have been personally verified before publishing.
Advertisements