Managing Linux System Loads and Monitoring in Production
From understanding what a load average actually means, to diagnosing a server on fire at 3am, a practical guide to Linux system monitoring for DevOps engineers and SREs. Theory first, production patterns second.


Advertisements
What Is System Load?
Before you can monitor a Linux system, you need a precise mental model of what "load" actually means. The term is used loosely "the server is under high load" but Linux has a specific, mathematical definition that is worth understanding from first principles.
System load is a measure of demand on a system's resources over time. Specifically, the Linux kernel tracks how many processes are either running or waiting to run (or waiting for I/O) at any given moment. This count is averaged over 1, 5, and 15-minute windows and reported as the load average.
The highway analogy
Think of a CPU core as a single-lane highway. Vehicles are processes that need to use the road. At any moment, vehicles are either driving (running on CPU) or queued at a toll booth (waiting for CPU time or I/O to complete).
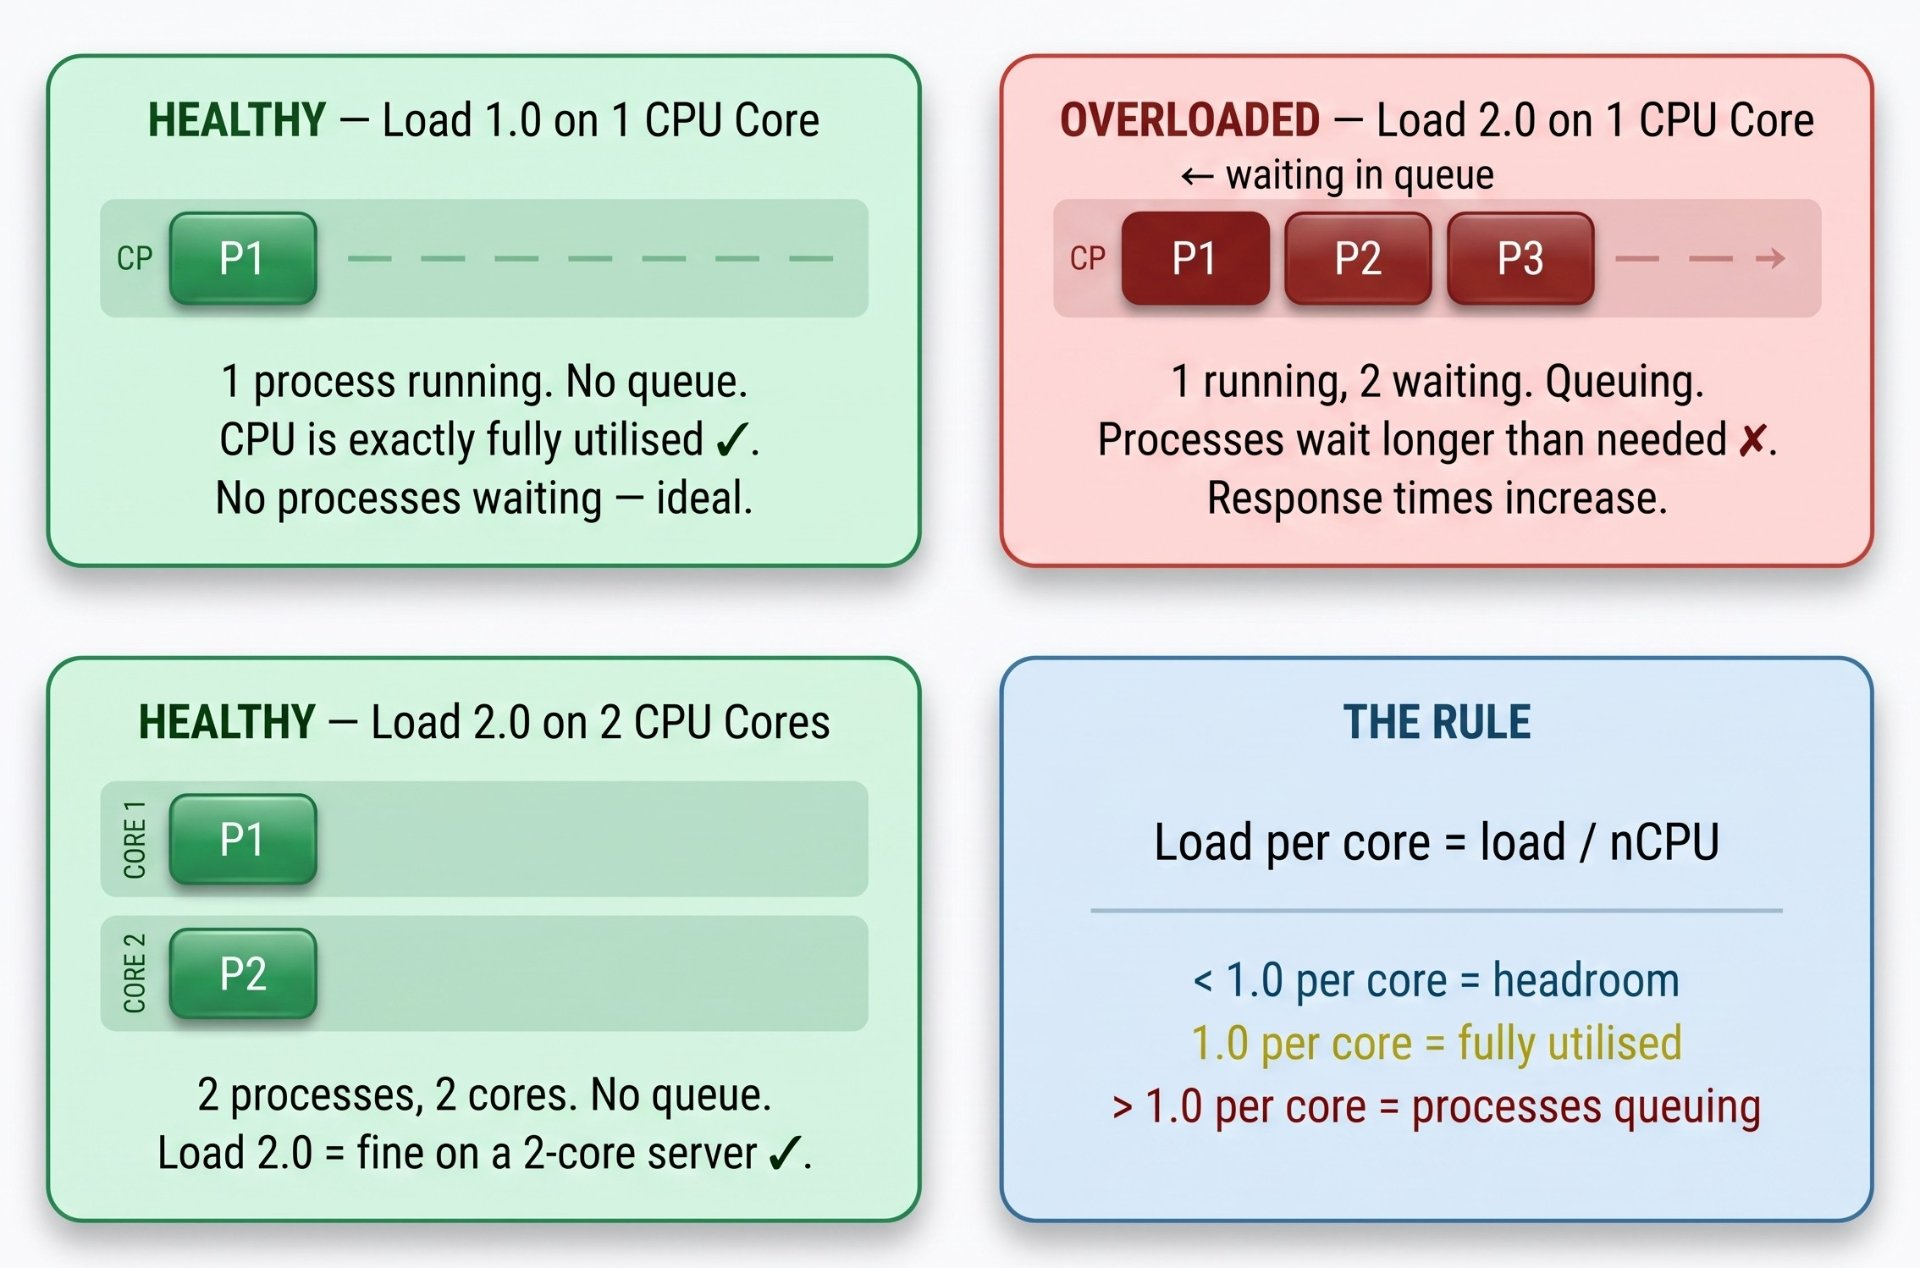
What the three numbers mean
Load average is always reported as three numbers for example 2.45 1.87 1.20. These are the average number of runnable processes over the last 1 minute, 5 minutes, and 15 minutes respectively.
Reading the Trend
The direction of the three numbers tells you as much as the values. If 1-min > 15-min, load is rising, something just happened. If 1-min < 15-min, load is falling — the spike is passing. A sustained spike across all three windows means the condition is not transient.
Load Average and CPU Cores
The first thing to know when you read a load average is how many CPU cores the server has. Load average is meaningless without that context.
How many CPU cores does this server have?
# Option 1 — nproc: simplest, returns logical CPU count
$ nproc
8

# Option 2 — lscpu: full CPU topology
$ lscpu | grep -E "^CPU\(s\)|^Core|^Socket|^Thread"
CPU(s):                  8
Core(s) per socket:      4
Socket(s):               1
Thread(s) per core:      2

# Option 3 — /proc/cpuinfo
$ grep -c "^processor" /proc/cpuinfo
8
With the core count known, you can calculate load per core — the number that actually matters. A server running at load 6.0 with 8 cores is at 75% utilisation — healthy. The same load on a 4-core server means every core has 1.5 processes queuing — a problem.
Hyperthreading Caveat
If your server uses Intel Hyperthreading (or AMD SMT), nproc returns logical CPUs — twice the physical core count. Hyperthreads share execution resources, so a load per logical CPU of 1.0 still means some queueing is happening. In production, treat hyperthreads as roughly 1.2–1.4x a physical core, not 2x.
Reading uptime, top, and htop
uptime — your fastest health check
$ uptime
 14:32:07 up 47 days, 3:12,  2 users,  load average: 1.24, 2.87, 3.91
                                                       ↑ 1min   ↑ 5min   ↑ 15min
This single line tells you a lot. The system has been up for 47 days, 2 users are logged in, and load is falling — the 15-minute average is highest (3.91), the 1-minute average is lowest (1.24). Something happened about 15–20 minutes ago and is now resolving. On an 8-core server this is fine. On a 2-core server the historical 3.91 was a serious problem.
top — the live process dashboard
$ top
top - 14:32:07 up 47 days,  load average: 1.24, 2.87, 3.91
Tasks: 312 total,   2 running, 310 sleeping,   0 stopped,   0 zombie
%Cpu(s): 12.3 us,  3.1 sy,  0.0 ni, 82.1 id,  2.4 wa,  0.0 hi,  0.1 si
MiB Mem :  15870.4 total,   2341.2 free,   8921.6 used,   4607.6 buff/cache
MiB Swap:   2048.0 total,   2031.4 free,     16.6 used.   6408.0 avail Mem

  PID USER      PR  NI    VIRT    RES    SHR S  %CPU  %MEM     TIME+ COMMAND
 4821 www-data  20   0 1.245g 421.2m  18.4m S  38.7   2.6   4:12.33 php-fpm
 2341 mysql     20   0 2.112g 912.4m  14.2m S  22.1   5.6   2:48.17 mysqld
 1204 elastic+  20   0 8.012g   2.1g 124.3m S  8.4  13.6  18:34.01 java
  892 redis     20   0  142.3m  12.4m   4.1m S   1.2   0.1   0:42.07 redis-server
Decoding the CPU line — the most important line in top
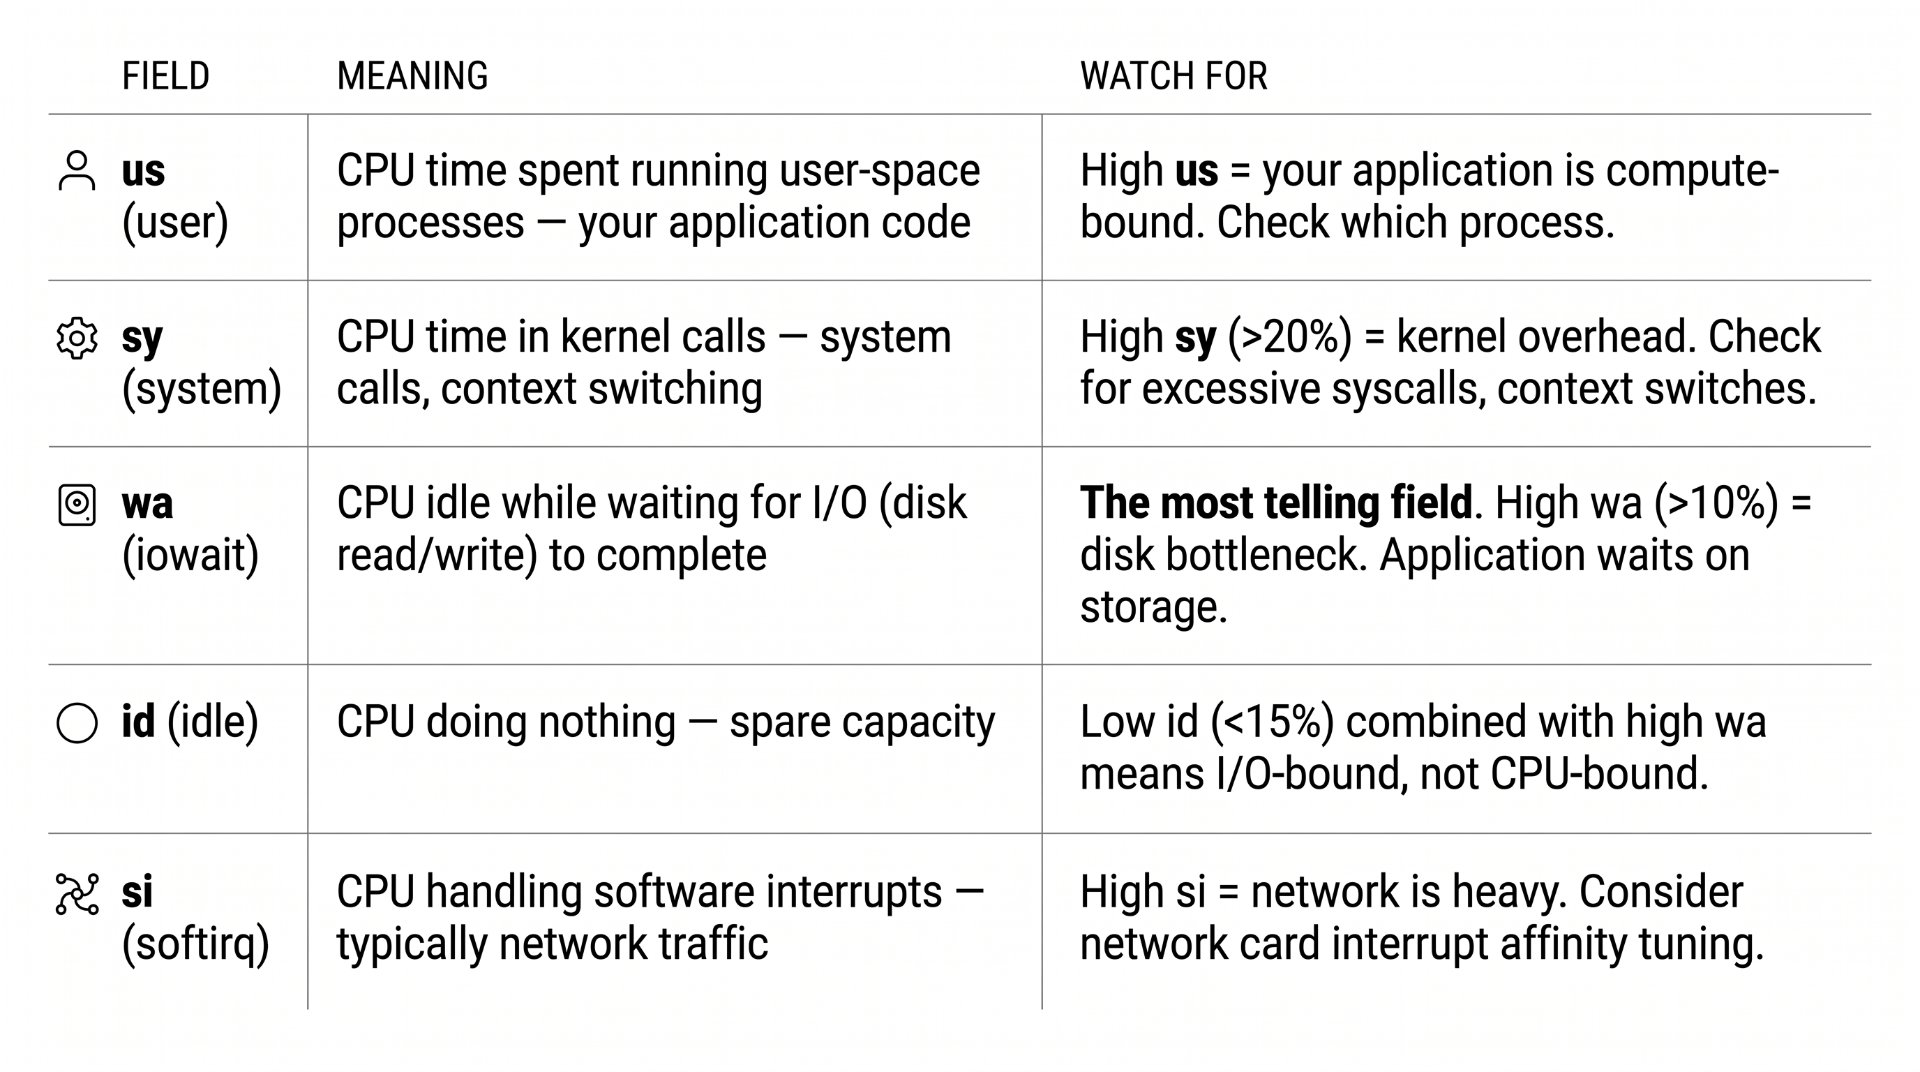
CPU-Bound vs I/O-Bound — The Critical Distinction
High load from CPU-bound processes means your application is computing. Adding more CPUs helps. High load from I/O-bound processes (high wa) means processes are waiting for disk — adding CPUs doesn't help at all. You need faster storage or reduced I/O. Always identify which type of load you have before scaling.
Essential top keyboard shortcuts
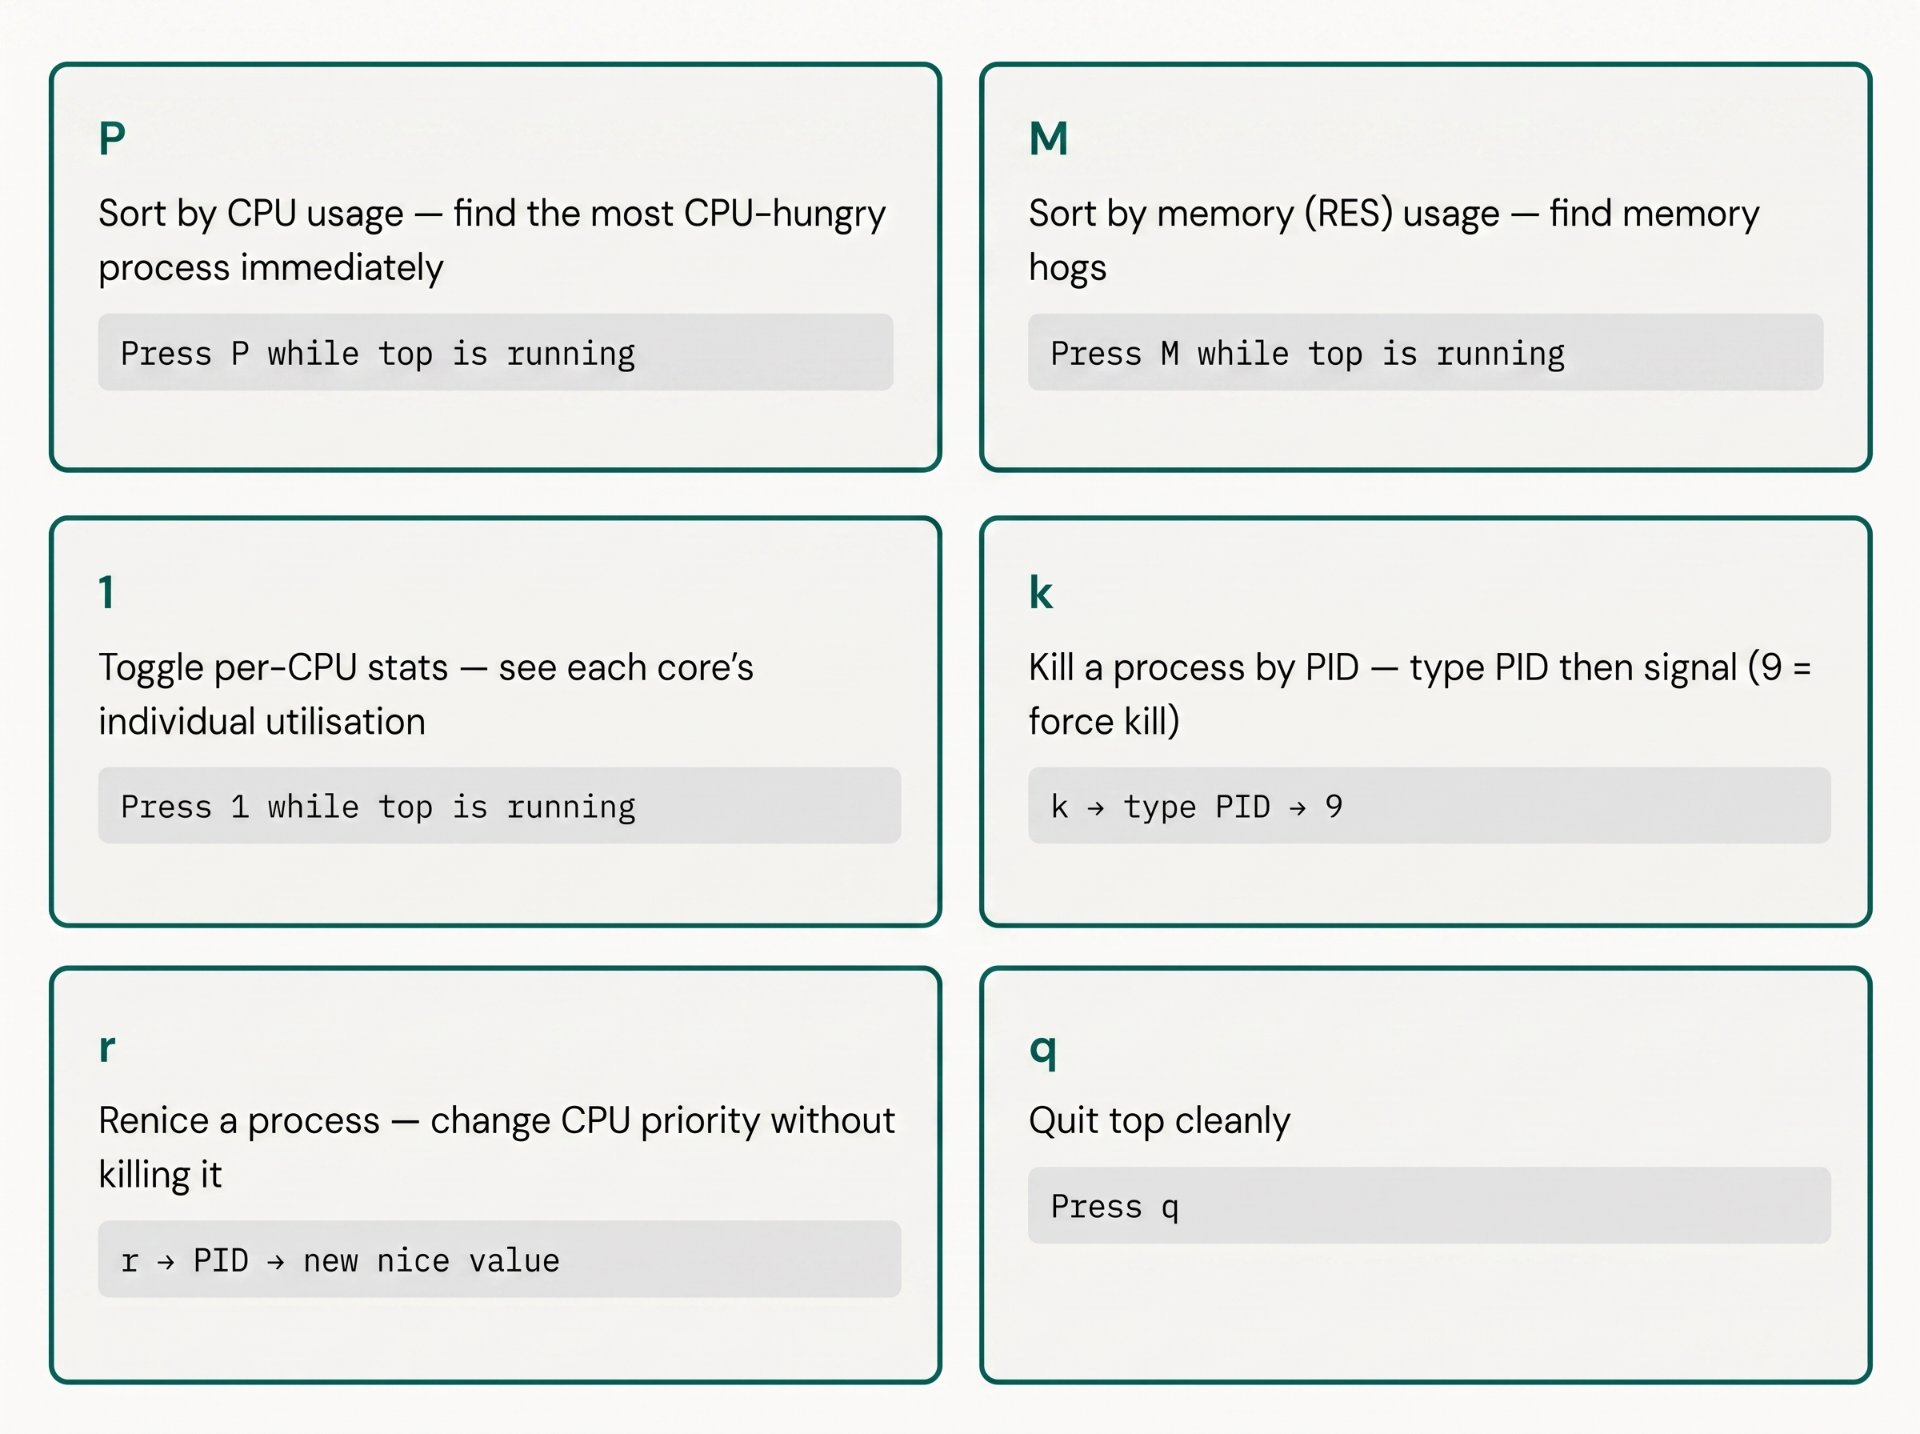
htop — top with a better interface
htop is a modern replacement for top. Install it with apt install htop or yum install htop. The advantage: colour-coded CPU and memory bars, mouse support, F-key shortcuts, and a tree view that shows parent-child process relationships. In production, htop is the tool you reach for first.
# Install htop
apt install htop          # Debian/Ubuntu
yum install htop          # RHEL/CentOS

# Useful htop flags
htop -u www-data          # show only www-data's processes
htop -p 4821,2341         # monitor specific PIDs
htop -d 5 # refresh every 0.5 seconds (d=tenths of seconds)Process States and Management
Every process in Linux is always in one of a small number of states. Understanding these states is essential for diagnosing problems — a process in the wrong state for too long is a symptom of something specific.
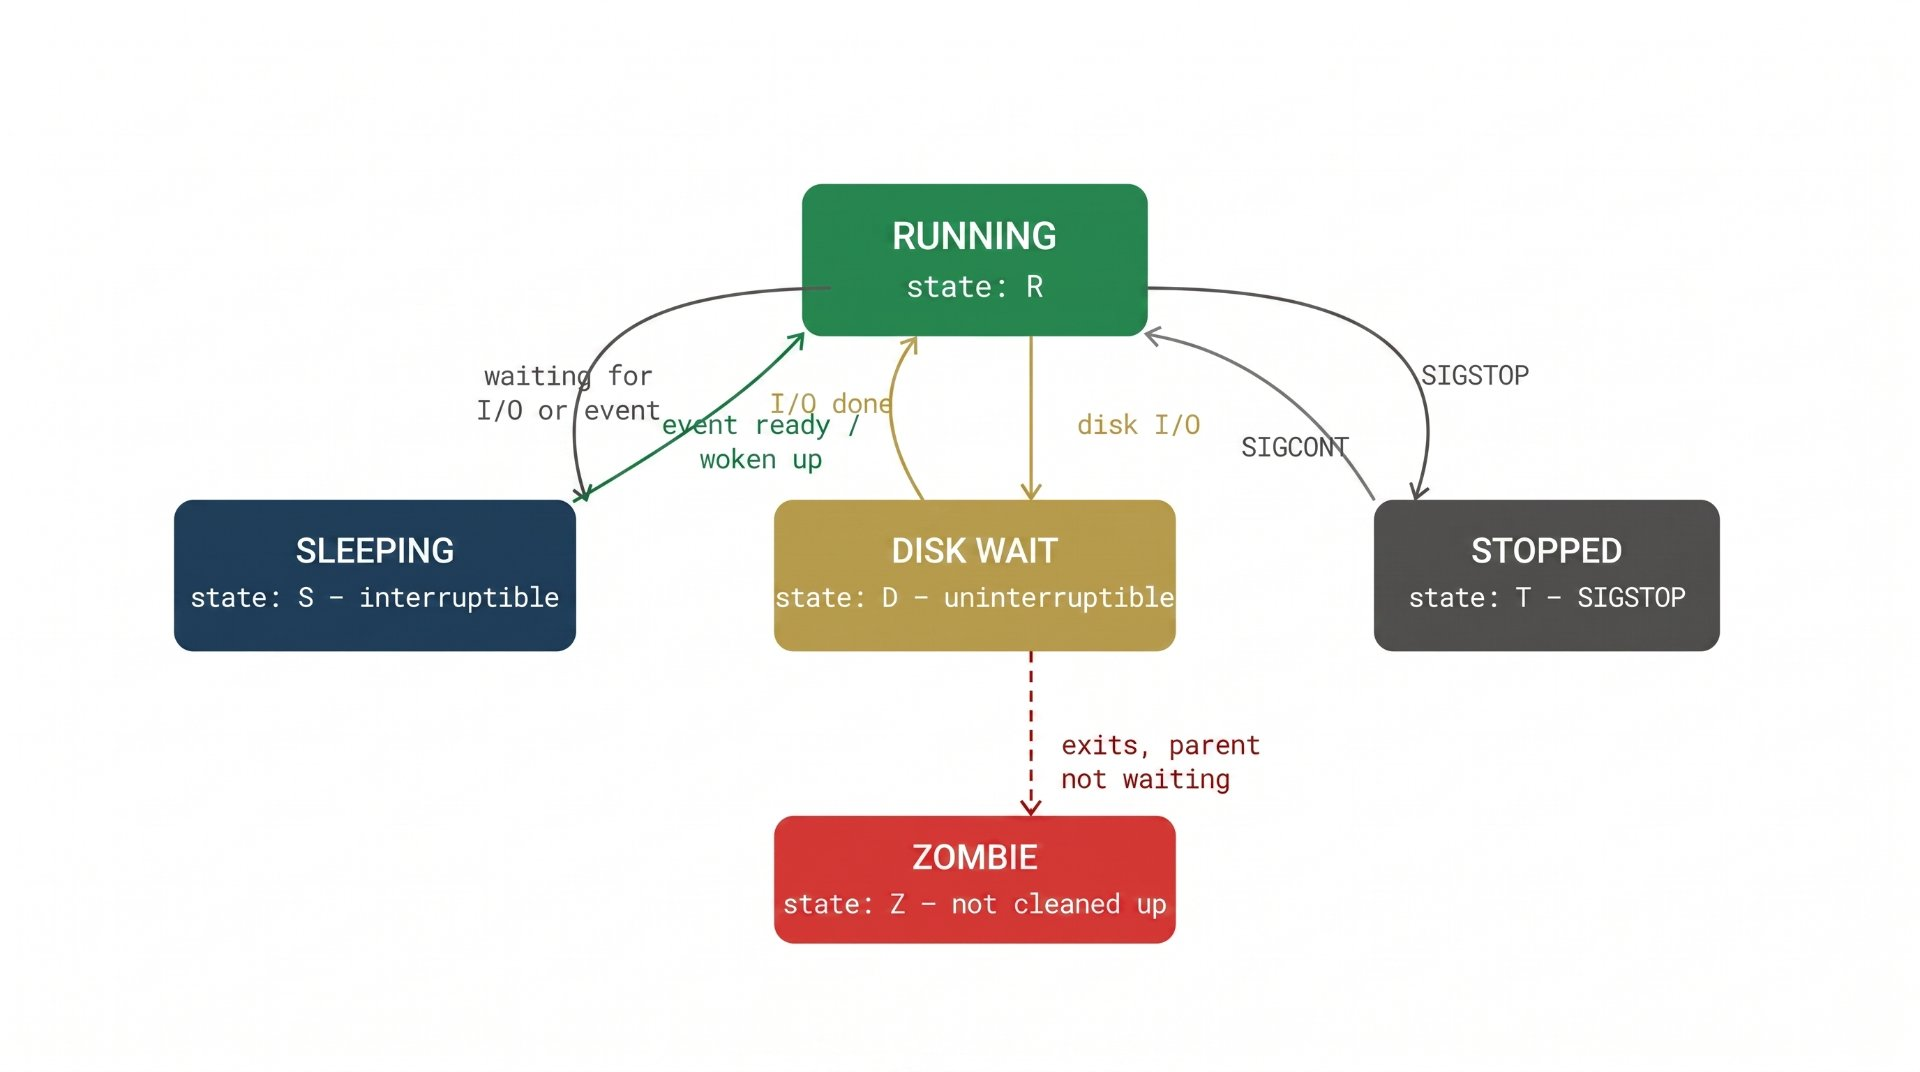
The D state — uninterruptible sleep
The state most engineers don't understand until it bites them in production is D (uninterruptible sleep). A process in D state is waiting for a kernel I/O operation to complete and cannot be killed — even kill -9 won't work. This is by design: the kernel cannot safely interrupt a raw disk operation.
A server with many processes stuck in D state will show high load average but low CPU usage — a confusing combination. The cause is almost always a storage problem: a failing disk, a full disk, an NFS mount that has gone unresponsive, or an overloaded database. The fix is fixing the underlying I/O issue, not killing processes.
Find processes in D state
# ps shows D state processes
$ ps aux | awk '$8 ~ /^D/ { print $0 }'

# Or with top — look for D in the S column
$ top  # then look at the S column — D means uninterruptible

# Count D-state processes — if count > 10, investigate immediately
$ ps aux | grep -c "^.\{8\}D"
Process signals — kill is not just for killing
# List all signals
kill -l

# The signals you use most in production:
kill -1  <PID>    # SIGHUP  — reload config (nginx, apache graceful reload)
kill -2  <PID>    # SIGINT  — same as Ctrl+C — clean interrupt
kill -15 <PID>    # SIGTERM — polite termination, allows cleanup (DEFAULT)
kill -9  <PID>    # SIGKILL — immediate force kill, no cleanup
kill -19 <PID>    # SIGSTOP — pause a process (like Ctrl+Z)
kill -18 <PID>    # SIGCONT — resume a paused process

# PRODUCTION RULE: always try SIGTERM first, wait 10s, then SIGKILL
# SIGKILL on a database process can leave data in inconsistent state

# Kill all processes by name
pkill php-fpm       # sends SIGTERM to all php-fpm processes
pkill -9 php-fpm    # force kill — only if SIGTERM didn't work
nice and renice — CPU priority
Every process has a nice value from -20 (highest priority, more CPU) to +19 (lowest priority, less CPU). Normal processes start at 0. As a DevOps engineer you use nice to give background batch jobs less priority so they don't compete with production workloads.
# Run a new process with lower priority (won't compete with production)
nice -n 15 php artisan queue:work

# Change priority of a running process
renice -n 10 -p 4821    # lower priority of PID 4821
renice -n -5 -p 1204    # raise priority (requires root)

# Lower priority for an entire process group
renice -n 15 -g <pgid>Memory — The Real Story
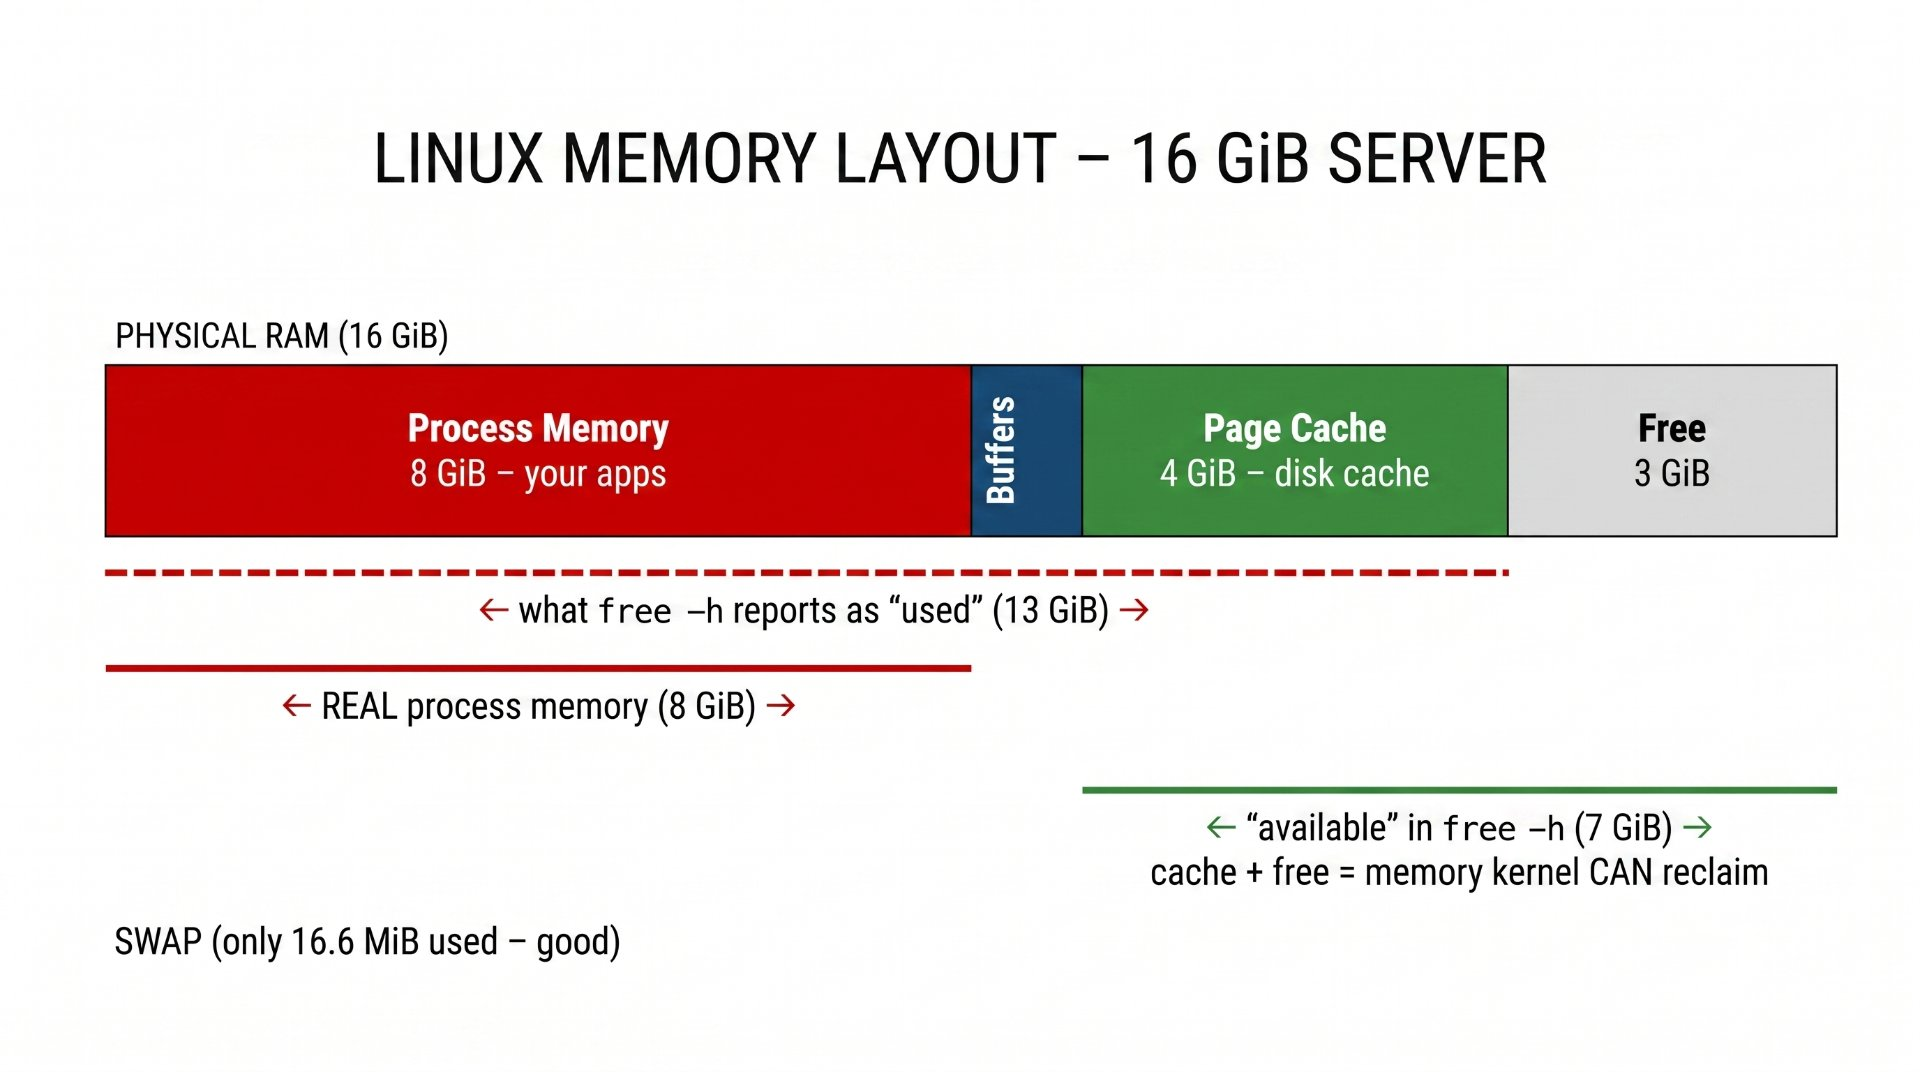
Memory monitoring in Linux confuses most engineers because the output of free looks alarming. "Only 200MB free? The server is about to die!" — except it isn't. Understanding how Linux uses memory requires knowing what "used" actually means.
The free command — reading it correctly
$ free -h
               total        used        free      shared  buff/cache   available
Mem:            15Gi        8.7Gi       2.3Gi       412Mi       4.5Gi       6.1Gi
Swap:          2.0Gi         16Mi       2.0Gi


# ─── What to read ─────────────────────────────────────────────
# IGNORE:  "free"     → RAM not used for anything (Linux keeps this near zero)
# WATCH:   "available" → what new processes can actually use
#          = free + page cache that can be reclaimed
# WORRY IF: available < 10% of total, OR swap "used" is climbing
# ──────────────────────────────────────────────────────────────
The Golden Rule of Linux Memory
Unused RAM is wasted RAM. Linux aggressively uses free memory as page cache — this makes subsequent reads from disk much faster because the data is already in memory. "Used" in free includes this cache. The number that actually matters for memory pressure is available. As long as available is substantial and swap usage is low, memory is not a problem even if used looks high.
The OOM Killer — Linux's last resort
When available memory is exhausted and no more can be reclaimed from cache, the Linux kernel invokes the Out Of Memory (OOM) Killer. It selects a process to kill — using a scoring algorithm that considers memory usage, process age, and OOM score — to reclaim enough memory for the system to continue.
In production, an OOM kill is serious: a database process killed by OOM can leave data inconsistent, and the logs rarely make it obvious what happened.
# Check for OOM kills — look for these in kernel logs
dmesg | grep -i "oom\|killed process\|out of memory"
journalctl -k | grep -i "oom"

# Example OOM log output:
[123456.789] Out of memory: Kill process 4821 (php-fpm) score 482 or sacrifice child
[123456.790] Killed process 4821 (php-fpm) total-vm:1245680kB, anon-rss:432148kB

# Protect critical processes from OOM kill (score -17 = never kill)
echo -17 > /proc/<mysqld_PID>/oom_adj      # older kernels
echo -1000 > /proc/<mysqld_PID>/oom_score_adj  # modern kernels

# Check OOM score of a process (higher = more likely to be killed)
cat /proc/4821/oom_score
Monitoring swap usage
# Watch swap in/out over time (vmstat)
$ vmstat 2 5
procs -----------memory---------- ---swap-- -----io---- -system-- ------cpu-----
 r  b   swpd   free   buff  cache   si   so    bi    bo   in   cs us sy id wa
 2  0 432000 284000  12000 612000    42   38   124   286  312  624 22  4 72  2

# si = swap in  (reading FROM swap into RAM — pressure relief)
# so = swap out (writing TO swap FROM RAM — memory is full)
# PROBLEM: sustained si/so > 0 means you're running out of memory
# CRITICAL: si/so in hundreds means the server is thrashingDisk I/O Monitoring
Disk I/O is the most common bottleneck on production servers running databases, Elasticsearch, or any workload that reads and writes large amounts of data. The CPU iowait percentage from top tells you that disk is the problem — iostat tells you which disk and what kind of I/O.
iostat — the disk monitoring tool
# Install sysstat (provides iostat, sar)
apt install sysstat

# Basic iostat — snapshot of all disks
$ iostat -xh 2
Device            r/s     w/s     rMB/s   wMB/s  r_await w_await  util
nvme0n1         412.3    228.7    31.4    18.2    0.8     12.4   94.2%
sda               4.1      1.2     0.2     0.1    0.6      0.8    0.4%


# The critical columns:
# util    → % of time the device was busy. >80% is concerning. >95% is critical.
# r_await → avg wait for reads (ms). SSD: <1ms normal. HDD: <10ms normal.
# w_await → avg wait for writes (ms). High = disk queue is backing up.
# r/s w/s → reads and writes per second — IOPS
util > 80% — Investigate Immediately
When disk utilisation exceeds 80% sustained, I/O requests begin to queue. Every process waiting on disk shows up as iowait CPU and contributes to load average. At 95%+ util, the I/O queue is deep and response times spike. Find which process is causing the I/O with iotop — then decide whether to optimise queries, add caching, or upgrade storage.
iotop — which process is hammering the disk
# Install iotop
apt install iotop

# Run iotop — shows per-process disk I/O in real time
$ iotop -o   # -o shows only processes doing I/O

Total DISK READ:       31.42 MiB/s | Total DISK WRITE:      18.21 MiB/s
  TID  PRIO  USER     DISK READ  DISK WRITE  SWAPIN    IO>  COMMAND
 2341 be/4 mysql     28.12 MiB/s  16.42 MiB/s  0.00 %  82.4 %  mysqld
 4821 be/4 www-data   1.24 MiB/s   0.84 MiB/s  0.00 %   4.2 %  php-fpm
 1204 be/4 elastic+   2.06 MiB/s   0.95 MiB/s  0.00 %  12.8 %  java
# Find which files a process is reading/writing
lsof -p 2341 | grep REG | head -20 # REG = regular files
# Watch disk usage over time with df
watch -n 5 'df -h | grep -v tmpfs'
# Find what's eating disk space
du -sh /* 2>/dev/null | sort -rh | head -20
du -sh /var/log/* | sort -rh | head -10 # logs are a common culpritNetwork Monitoring
ss — the modern netstat
netstat is deprecated. ss (socket statistics) is faster, more informative, and is the current standard. Learn ss.
# All listening ports with process names
$ ss -tlnp
State    Recv-Q  Send-Q   Local Address:Port    Peer Address:Port  Process
LISTEN   0       128      0.0.0.0:80           0.0.0.0:*          users:(("apache2",pid=892))
LISTEN   0       128      0.0.0.0:443          0.0.0.0:*          users:(("apache2",pid=892))
LISTEN   0       70       127.0.0.1:3306       0.0.0.0:*          users:(("mysqld",pid=2341))
LISTEN   0       128      127.0.0.1:6379       0.0.0.0:*          users:(("redis-server",pid=512))
LISTEN   0       128      0.0.0.0:9200         0.0.0.0:*          users:(("java",pid=1204))


# Flags: -t tcp, -l listening, -n numeric (no DNS), -p process names
# NOTICE: MySQL on 127.0.0.1 only (good — not externally accessible)
# NOTICE: Elasticsearch on 0.0.0.0:9200 — is this intentional? Firewall?

# Count established connections by state
ss -s
Total: 312
TCP:   142 (estab 87, closed 18, orphaned 2, timewait 18)

# Find what's connecting to port 80
ss -tn dst :80 | head -30

# Find processes with too many open connections (connection leak)
ss -tp | awk '{print $6}' | sort | uniq -c | sort -rn | head -10

# Watch TIME_WAIT connections — too many means keep-alive isn't working
ss -tan | grep TIME-WAIT | wc -l
Network throughput and bandwidth
# Real-time bandwidth per interface
apt install nload  &&  nload eth0

# Or with ifstat (shows in/out per interface)
apt install ifstat  &&  ifstat -i eth0 1

# Check interface errors — non-zero errors indicate hardware/cable issues
$ ip -s link show eth0
2: eth0: <BROADCAST,MULTICAST,UP,LOWER_UP>
    RX: bytes  packets  errors  dropped  missed  mcast
    18247836194  14238124  0       0       0      0
    TX: bytes  packets  errors  dropped carrier collsns
42819274810 28472918 0 0 0 0Historical Monitoring with sar
All the tools so far show you the current state. sar (System Activity Reporter) shows you the past. When a server had a problem at 3am and you're investigating at 9am, sar is how you reconstruct what happened. It's part of the sysstat package and requires enabling data collection.
# Enable sysstat data collection
systemctl enable sysstat
systemctl start sysstat

# Configure collection interval — edit /etc/sysstat/sysstat
# HISTORY=28  → keep 28 days of data

# View CPU history for today
$ sar -u
09:00:01  CPU     %user  %system  %iowait  %idle
09:10:01  all      8.24     2.31     0.42    89.03
09:20:01  all     12.44     3.21     0.88    83.47
03:10:01  all     82.44    14.21    38.44     2.91   ← that's the 3am incident
03:20:01  all     31.22     6.11     12.44    50.23

# View a specific day (e.g. 2 days ago)
sar -u -f /var/log/sysstat/sa$(date -d "2 days ago" +%d)

# Memory history
sar -r           # RAM usage over time
sar -W           # swap activity over time — critical for OOM investigation
sar -d           # disk activity over time
sar -n DEV       # network by interface over time
sar -q           # load average and run queue over time

# Full day summary — your first command when investigating an overnight incident
sar -A | less
Production Habit
Make sar collection part of your server build process. When a server is provisioned, sysstat should be installed and enabled on day one. You will never regret having historical data. You will definitely regret not having it when the 3am incident happens and you're flying blind.
Production Thresholds and Alerting
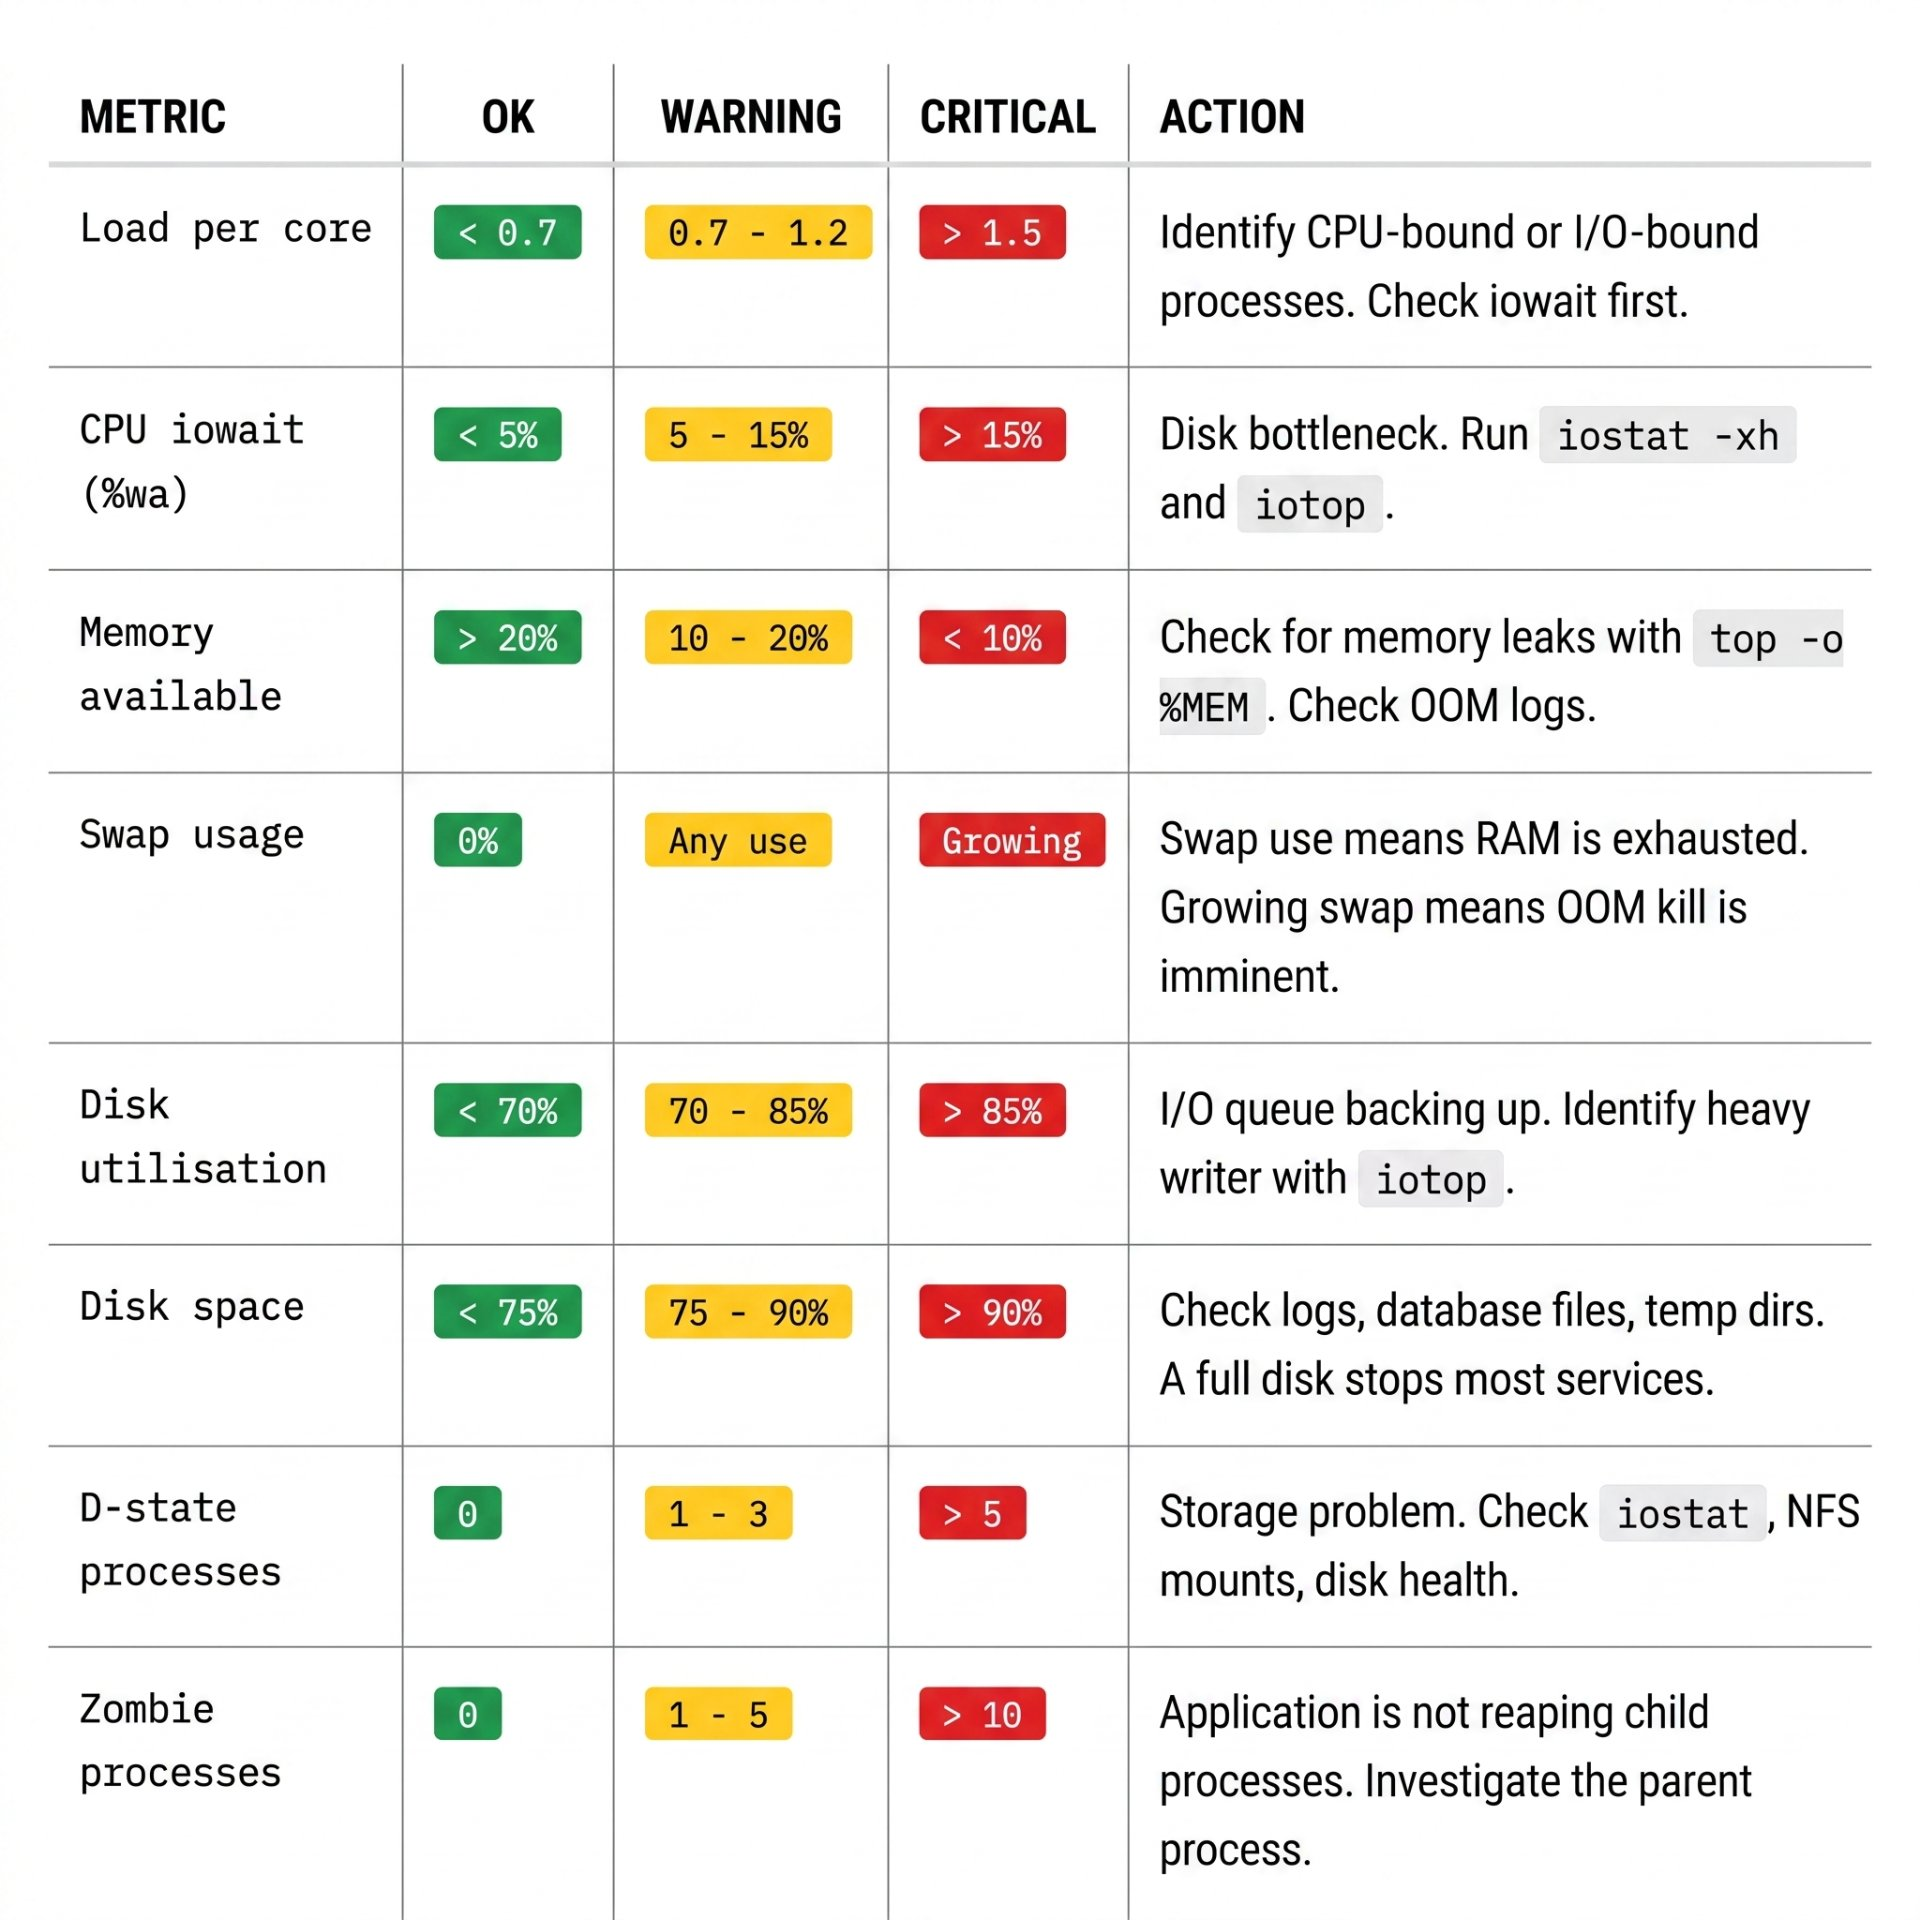
Knowing the tools is one half. Knowing when to act is the other. These are production-grade thresholds used by SRE teams. Use them as starting points — every system is different, and you should baseline your system's normal behaviour before setting alerts.
Setting up a quick monitoring dashboard with watch
For a quick ad-hoc dashboard when investigating a problem, combine watch with your monitoring commands:
# Refresh a comprehensive status every 2 seconds
watch -n 2 '
echo "=== LOAD ==="
uptime

echo ""
echo "=== TOP PROCESSES ==="
ps aux --sort=-%cpu | head -8

echo ""
echo "=== MEMORY ==="
free -h

echo ""
echo "=== DISK I/O ==="
iostat -dx 1 1 | tail -6

echo ""
echo "=== D-STATE PROCESSES ==="
ps aux | awk '"'"'$8 ~ /^D/'"'"'
'The 3am Diagnosis Methodology
The server is slow. Users are complaining. It's 3am. You have no prior context. Here is the systematic approach — follow it in order every time. Skipping steps leads to solving the wrong problem.
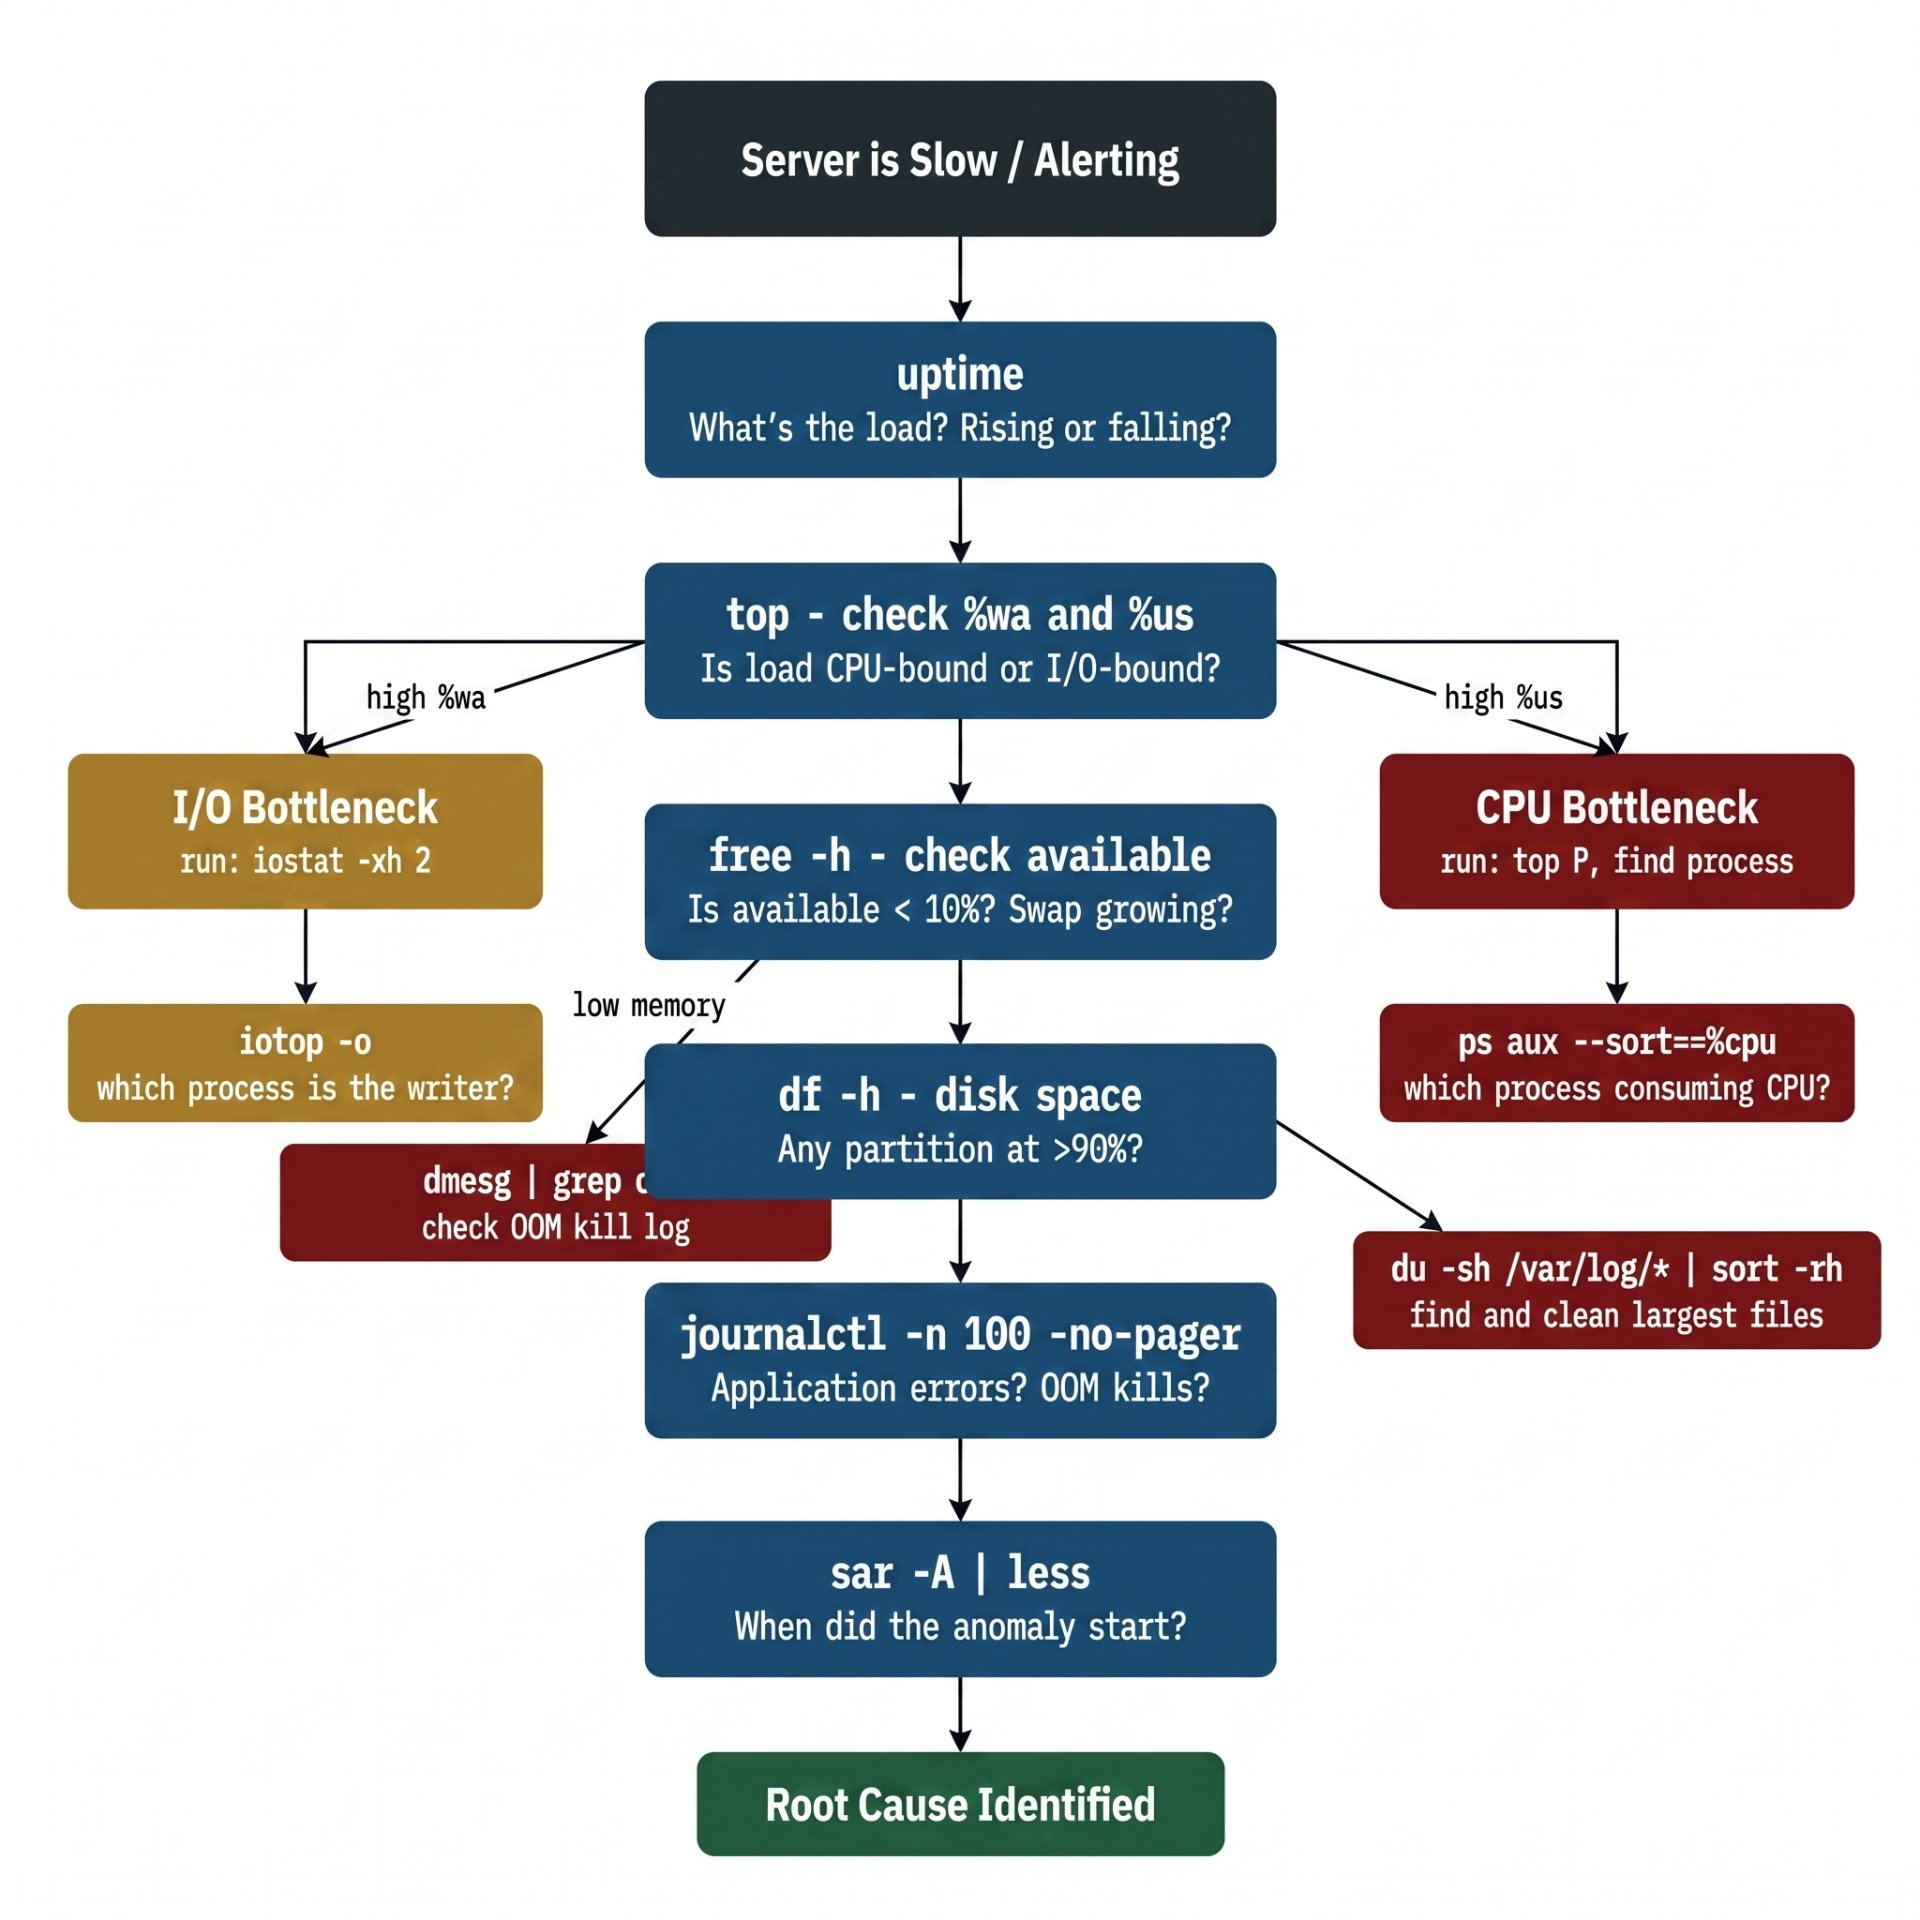
NOTE: dmesg | grep oom --- Check OOM kill log
The full first-response command sequence
Run these commands in this exact order when you first connect to a troubled server. Each one narrows the problem space before the next.
#!/bin/bash
# Production server first response — run top to bottom, in order

# 1. What's the load, and is it rising or falling?
uptime

# 2. Who is logged in — did someone just do something?
w

# 3. What just happened in the kernel log?
dmesg | tail -30
journalctl -n 50 --no-pager

# 4. CPU and memory overview — check %wa and available memory
top -bn1 | head -20

# 5. Is this I/O bound? (run for 5 seconds, 1s interval)
iostat -xh 1 5

# 6. Which process is writing most to disk?
iotop -ob -n 3 2>/dev/null || echo "iotop not installed — apt install iotop"

# 7. Memory and swap detail
free -h
vmstat 1 5

# 8. Is disk space the problem?
df -h

# 9. Any processes stuck in D state?
ps aux | awk '$8 ~ /^D/ { print NR, $0 }'

# 10. Any zombie processes?
ps aux | awk '$8 ~ /^Z/ { print $0 }'

# 11. Network — any unusual connections?
ss -s
ss -tn | awk '{print $5}' | cut -d: -f1 | sort | uniq -c | sort -rn | head -10

# 12. What did the system look like an hour ago? (requires sysstat)
sar -u -r -d 1 | tail -30
After Every Incident — Document It
Write a short post-mortem within 24 hours while memory is fresh: what the symptom was, what you found at each diagnosis step, what the root cause was, and what you changed to fix it. This is not bureaucracy — it's how you avoid solving the same problem twice, and how you build the runbook library that saves you at the next 3am incident.
Useful one-liners for your toolkit
# Find top 10 memory-consuming processes
ps aux --sort=-%mem | awk 'NR<=11{printf "%-10s %-8s %-8s %s\n",$1,$2,$4,$11}'

# Find open file counts per process (file descriptor leaks)
for pid in $(ls /proc | grep -E '^[0-9]+$'); do
  count=$(ls /proc/$pid/fd 2>/dev/null | wc -l)
  [ $count -gt 100 ] && echo "$count $pid $(cat /proc/$pid/comm 2>/dev/null)"
done | sort -rn | head -10

# CPU usage per process, aggregated by name (useful for multi-threaded apps)
ps aux --no-header | awk '{cpu[$11]+=$3; mem[$11]+=$4} END {for(p in cpu) printf "%.1f\t%.1f\t%s\n", cpu[p], mem[p], p}' | sort -rn | head -10

# Watch a specific process's resource use in real time
watch -n 1 'ps -p 4821 -o pid,ppid,cmd,%cpu,%mem,vsz,rss,stat'

# Find which process has a specific port open
ss -tlnp | grep :3306

# Check system call activity on a process (advanced — syscall tracing)
strace -p 4821 -c -f   # summary of syscalls — Ctrl+C to stop

# Monitor log file in real time and filter for errors
tail -f /var/log/syslog | grep -i "error\|crit\|emerg\|oom"

# Quick check: is load caused by many small processes or one big one?
ps r -A       # shows all currently RUNNING (R state) processes
Everything in Linux monitoring comes back to one question: what is the bottleneck? Resources compete — CPU, memory, disk I/O, and network are the four dimensions. A system is rarely bottlenecked on all four simultaneously. Find the one that's constrained first, fix it, then re-evaluate.
The load average alone tells you demand is high. The CPU breakdown (us, wa, sy) tells you what kind of demand. The process list tells you which process. The tool list (iostat, iotop, vmstat, ss) tells you the detail. And sar tells you the history that lets you understand whether this is a new problem or a slow-burning trend.
Run these tools regularly on healthy servers so you know what normal looks like. When something goes wrong, the deviation from normal is immediately obvious. That is the difference between a junior engineer who stares at numbers and a senior engineer who recognises patterns.
Author's Note
Chamath P.
DevOps Engineer
DevOps Engineer writing practical guides on Kubernetes, CI/CD, IaC, and SRE — based on real production experience.
This article was written with AI assistance. All technical claims and code examples have been personally verified before publishing.
Advertisements