Debugging & Troubleshooting Docker
Containers lie. Logs truncate. Processes vanish. Networks refuse to route. This is the field guide every tool, every signal, every technique for diagnosing what is actually wrong inside a running (or dead) container.

Advertisements
The debugging mindset — containers are processes
Before reaching for any tool, burn this into your mental model: a container is a Linux process. It has a PID on the host. It has file descriptors. It has a mount namespace you can enter. It writes to stdout and stderr. It consumes kernel resources tracked by cgroups. Every debugging technique in this article is just a way of looking at that process from a different angle.
The analogy
Debugging a container is like diagnosing a patient in an isolation ward. You can't walk in directly (the namespace is the isolation). But you have monitors on the wall (logs), you can take blood samples (inspect), you can send in an endoscope (exec), and you can read the hospital's event log (docker events). The patient is not unreachable you just need the right instruments.
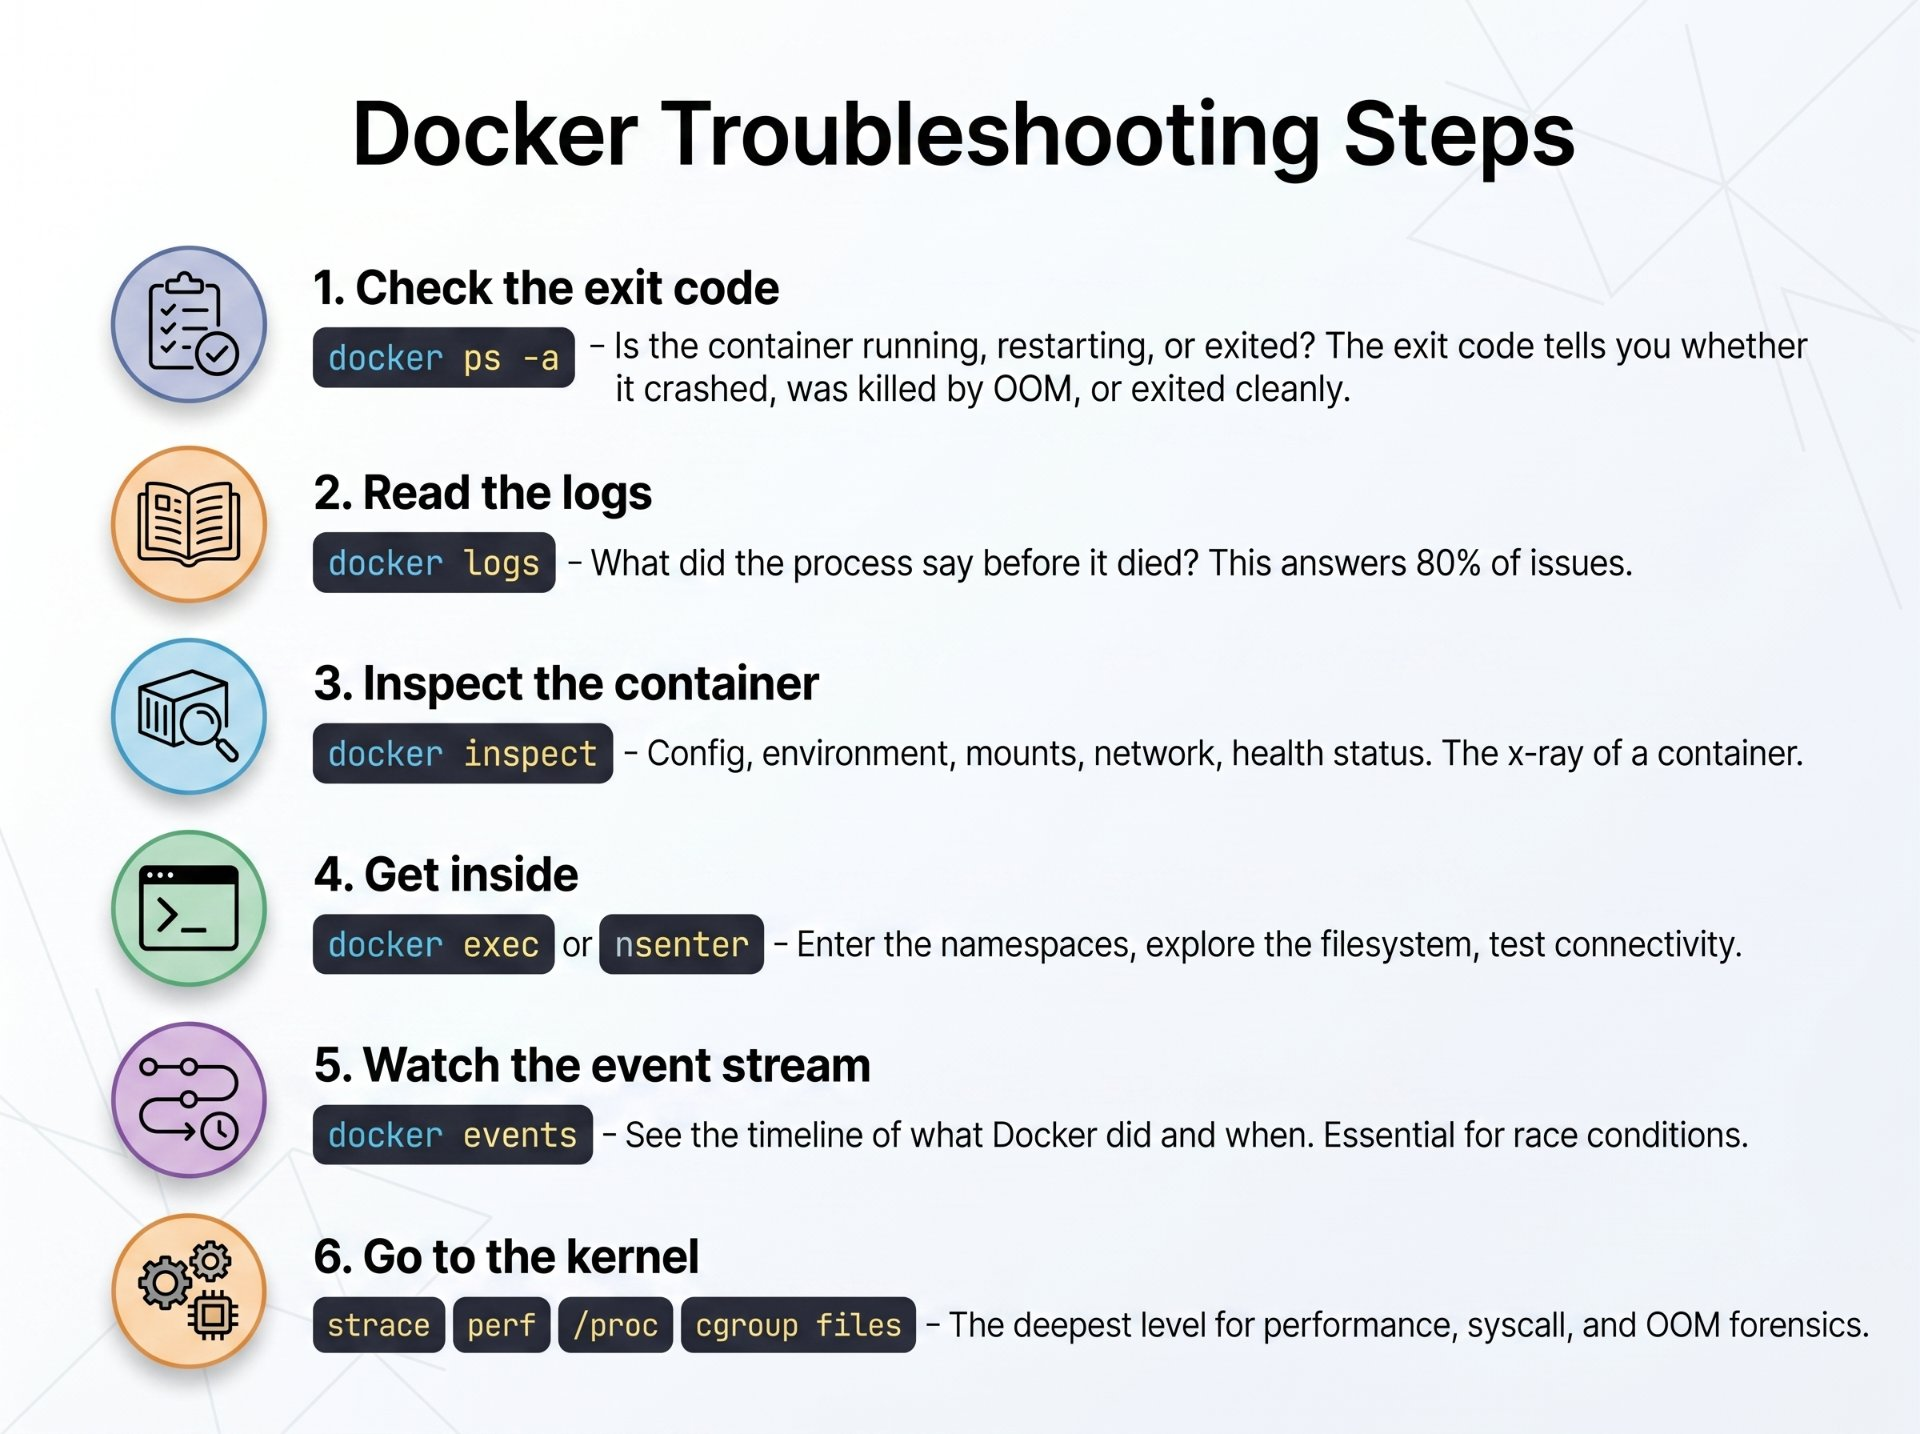
The debugging hierarchy always work from outside in, cheap to expensive:
Containers that won't start — exit code forensics
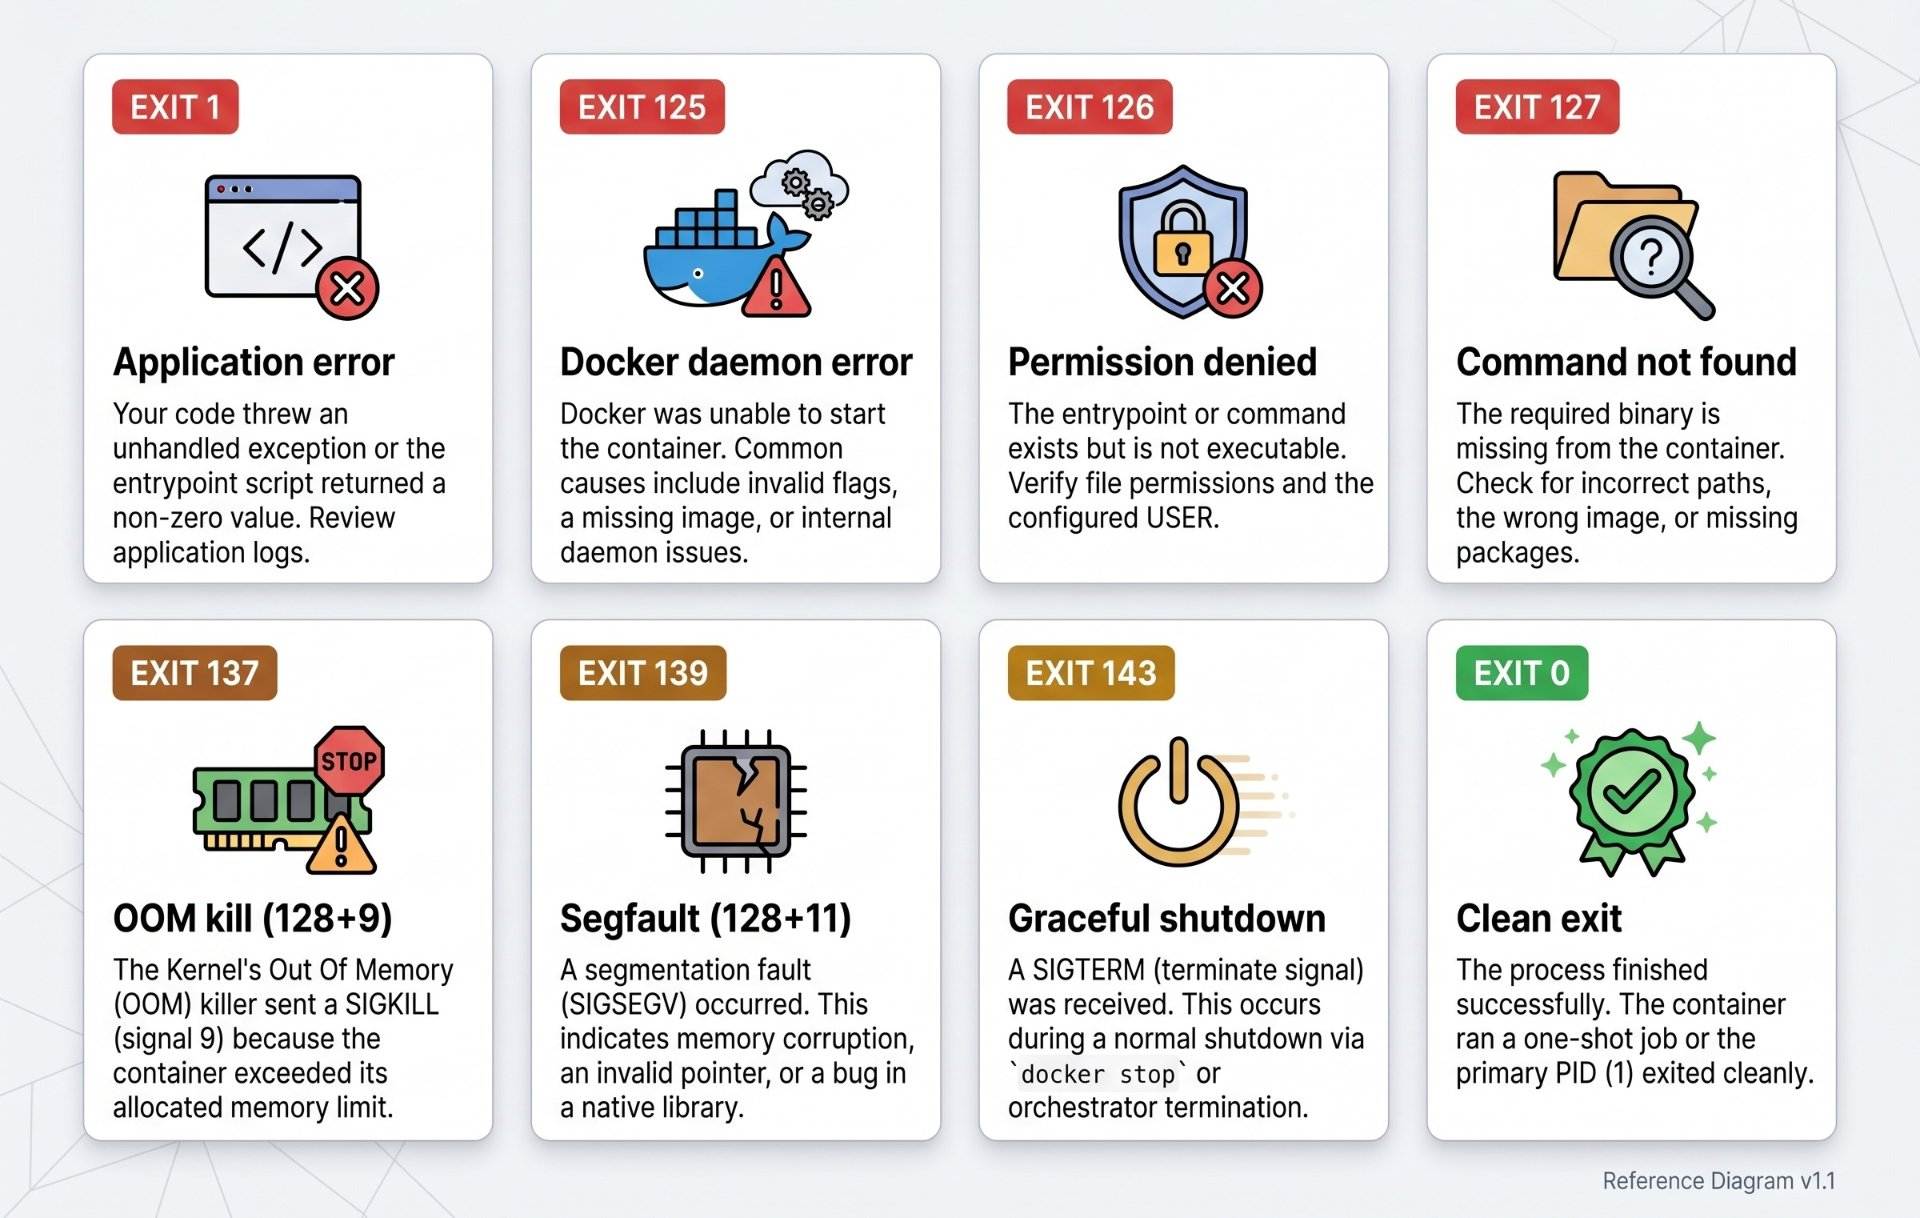
The exit code is the single most diagnostic piece of information a dead container provides. Most engineers ignore it and go straight to logs. Don't the exit code narrows the search space immediately.
# See all containers including stopped ones, with exit codes
docker ps -a --format "table {{.Names}}\t{{.Status}}\t{{.ExitCode}}"

# More detail on a specific container
docker inspect mycontainer --format '{{.State.ExitCode}} {{.State.Error}}'

# OOMKilled flag — true means the kernel killed it for memory
docker inspect mycontainer --format 'OOMKilled: {{.State.OOMKilled}}'

# Full state block
docker inspect mycontainer --format '{{json .State}}' | python3 -m json.tool
The "container immediately exits" problem
A container starts and exits with code 0 in under a second. This almost always means PID 1 is a shell script or short-lived command, not a long-running daemon. Docker stops the container when PID 1 exits regardless of any other processes running inside.
# Override the entrypoint to get a shell — see what's actually happening
docker run -it --entrypoint /bin/sh myimage

# Or if it's a distroless image with no shell, run a debug sidecar
# (see Section 10 for distroless debugging)

# Add --rm so it cleans up, useful for iterating
docker run --rm -it --entrypoint sh myimage -c "ls -la /app && cat /app/config.json"

# Keep a container alive even if PID 1 exits (for inspection)
docker run -d --entrypoint tail myimage -f /dev/null

# Check the last 200 lines of logs from an already-dead container
docker logs --tail 200 mycontainer

# Check logs with timestamps to understand timing
docker logs -t mycontainer 2>&1 | head -50
The PID 1 signal problem
If your entrypoint is a shell script that execs your app, signals from docker stop go to the shell (PID 1), not your app. Your app never gets SIGTERM and doesn't shut down gracefully Docker waits 10 seconds, then sends SIGKILL. Fix: use exec in your shell script's last line, or use the JSON array form of CMD/ENTRYPOINT which bypasses the shell entirely.
# WRONG — shell form: Docker runs /bin/sh -c "node server.js"
# PID 1 is /bin/sh, not node. SIGTERM goes to sh, node never sees it.
CMD node server.js

# RIGHT — exec form: Docker runs node directly as PID 1
CMD ["node", "server.js"]

# RIGHT — shell script that properly hands off with exec
#!/bin/sh
set -e
echo "Running migrations..."
node migrate.js
echo "Starting server..."
exec node server.js # exec replaces the shell — node becomes PID 1Reading logs like a pro
Docker captures everything a container writes to stdout and stderr. But raw docker logs gets unwieldy fast. Here are the options and techniques most engineers don't know exist.
# Basic — last 100 lines, follow new output
docker logs -f --tail 100 mycontainer

# With timestamps (essential for correlating events)
docker logs -t mycontainer

# Logs since a specific time (RFC3339 or relative)
docker logs --since 2024-01-15T14:30:00 mycontainer
docker logs --since 30m mycontainer     # last 30 minutes
docker logs --until 2024-01-15T15:00:00 mycontainer

# Logs from a specific time window
docker logs --since 1h --until 30m mycontainer

# stderr only (useful when stdout is noisy)
docker logs mycontainer 2>&1 1>/dev/null | less

# stdout only
docker logs mycontainer 2>/dev/null | grep ERROR

# Multi-container — compose stack logs with service filter
docker compose logs -f api worker --since 30m

# Count errors in the last hour
docker logs --since 1h mycontainer 2>&1 | grep -c ERROR

# Extract structured JSON logs and pretty-print
docker logs mycontainer 2>&1 | jq 'select(.level == "error")'

# Follow logs from ALL running containers
docker ps -q | xargs -I{} docker logs -f --tail 20 {} &
Configuring the logging driver
The default json-file driver stores logs on disk with no rotation by default they grow forever and will fill your disk. Always configure rotation. For production, consider shipping logs to a centralised sink.
services:
  api:
    logging:
      driver: json-file         # default — allows docker logs
      options:
        max-size: "20m"          # rotate after 20 MB
        max-file: "5"           # keep 5 rotated files = max 100 MB
        compress: "true"        # gzip old files
        tag: "{{.Name}}/{{.ID}}"  # include container name in log metadata

  # Production: ship to a log aggregator
  worker:
    logging:
      driver: fluentd            # or: awslogs, gelf, splunk, loki
      options:
        fluentd-address: "localhost:24224"
        tag: "myapp.worker"
        # fluentd-async: "true" — don't block if fluentd is down
        fluentd-async: "true"
The non-blocking logging trap
Non-default logging drivers (fluentd, awslogs, gelf) are blocking by default if the log sink is unavailable, your container hangs waiting to write a log line. Always set the async or non-blocking option for these drivers. For fluentd: fluentd-async: "true". For awslogs: awslogs-multiline-pattern with mode: non-blocking and max-buffer-size: 4m.
docker inspect — the container x-ray
docker inspect returns the complete runtime state of a container as JSON. It is the single most information-dense debugging command available. Learn to use --format to extract specific fields without parsing JSON manually.
# Full dump (pipe to jq or python for readability)
docker inspect mycontainer | jq '.[0]'

# ── Network ──────────────────────────────────────────────────
# IP address on a specific network
docker inspect mycontainer \
  --format '{{.NetworkSettings.Networks.myapp_internal.IPAddress}}'

# All networks and IPs
docker inspect mycontainer \
  --format '{{range $k,$v := .NetworkSettings.Networks}}{{$k}}: {{$v.IPAddress}}{{"\n"}}{{end}}'

# ── Mounts ───────────────────────────────────────────────────
docker inspect mycontainer --format '{{json .Mounts}}' | jq

# ── Environment ──────────────────────────────────────────────
docker inspect mycontainer --format '{{range .Config.Env}}{{println .}}{{end}}'

# ── Health status ────────────────────────────────────────────
docker inspect mycontainer --format '{{json .State.Health}}' | jq
# Shows: Status, FailingStreak, Log (last 5 health check results + output)

# ── Resource limits ──────────────────────────────────────────
docker inspect mycontainer --format \
  'Memory: {{.HostConfig.Memory}} NanoCPUs: {{.HostConfig.NanoCpus}}'

# ── Restart policy & restart count ───────────────────────────
docker inspect mycontainer --format \
  'Restarts: {{.RestartCount}} Policy: {{.HostConfig.RestartPolicy.Name}}'

# ── PID on host (for nsenter) ────────────────────────────────
docker inspect mycontainer --format '{{.State.Pid}}'
Inspect stopped or dead containers
docker inspect works on stopped and exited containers not just running ones. This is your primary tool for post-mortem analysis. The container record persists until you docker rm it. Always inspect before removing.
Getting inside a container — exec, nsenter, and ephemeral debug containers
docker exec — the front door
# Interactive shell (most common)
docker exec -it mycontainer sh         # alpine/distroless uses sh
docker exec -it mycontainer bash       # debian/ubuntu-based

# Run as root even if container runs as non-root
docker exec -it -u root mycontainer sh

# Run in a specific working directory
docker exec -it -w /app/config mycontainer sh

# Non-interactive one-liner — great for scripts
docker exec mycontainer cat /app/config.json
docker exec mycontainer env | grep DATABASE

# Check open file descriptors (useful for fd leak debugging)
docker exec mycontainer ls -la /proc/1/fd | wc -l

# Check what the process is listening on
docker exec mycontainer ss -tlnp
docker exec mycontainer netstat -tlnp   # if ss not available

# Memory map of PID 1
docker exec mycontainer cat /proc/1/maps | head -30

# See all running processes inside
docker exec mycontainer ps aux
nsenter — the back door (when exec fails)
docker exec requires the container to be running and the Docker daemon to be available. nsenter works at the kernel level entering namespaces directly by PID. It works even when the Docker daemon is in a bad state, and it gives you access to namespaces docker exec doesn't expose (like the network namespace of a paused container).
# Get the container's host PID
PID=$(docker inspect mycontainer --format '{{.State.Pid}}')

# Enter ALL namespaces — most complete debug context
sudo nsenter -t $PID --mount --uts --ipc --net --pid -- sh

# Enter only the network namespace (useful for net debugging)
# You can run host tools (tcpdump, ip) in the container's network context
sudo nsenter -t $PID --net -- ip addr
sudo nsenter -t $PID --net -- ss -tlnp
sudo nsenter -t $PID --net -- tcpdump -i eth0 -n port 5432

# Enter only the mount namespace — see the container's filesystem
sudo nsenter -t $PID --mount -- ls /app

# Copy a file OUT of a container's namespace to the host
sudo nsenter -t $PID --mount -- cat /app/config.json > /tmp/container-config.json
Ephemeral debug containers — for production distroless images
Your production image has no shell, no curl, no ps. But you need to debug a live issue. Kubernetes has kubectl debug. In plain Docker, use --pid namespace sharing to attach a debug container to the target container's process namespace.
# Attach a debug container that shares the target's PID and network namespaces
# You can now see all processes and network state of the target
docker run -it --rm \
  --pid=container:mycontainer \
  --network=container:mycontainer \
  --cap-add SYS_PTRACE \
  nicolaka/netshoot   # packed with: tcpdump, curl, dig, ss, strace, etc

# Inside netshoot you can now:
$ ps aux             # see mycontainer's processes
$ tcpdump -i eth0    # capture mycontainer's traffic
$ curl localhost:3000 # hit mycontainer's app on its loopback
$ strace -p 1        # trace mycontainer's PID 1 syscalls

# Alternative: busybox for a minimal shell + basic tools
docker run -it --rm \
  --pid=container:mycontainer \
  --network=container:mycontainer \
busybox shNetwork debugging — when containers can't talk to each other
Network issues in Docker follow predictable patterns. The container can't reach another service but is it a DNS issue, a routing issue, a firewall (iptables) issue, or an application binding issue? Work through them in order.
# ── Step 1: Can the container resolve DNS? ────────────────────
docker exec mycontainer nslookup db          # service name → IP?
docker exec mycontainer cat /etc/resolv.conf  # what DNS server is configured?
docker exec mycontainer nslookup google.com   # can it reach external DNS?

# ── Step 2: Can it reach the IP? ────────────────────────────
docker exec mycontainer ping -c 3 172.18.0.3  # replace with actual IP
# If ping fails but DNS resolves: routing or firewall issue

# ── Step 3: Is the port open? ────────────────────────────────
docker exec mycontainer nc -zv db 5432        # netcat port check
docker exec mycontainer curl -v http://api:3000/health

# ── Step 4: Is the app actually listening? ───────────────────
docker exec db ss -tlnp | grep 5432
# CRITICAL: is it 0.0.0.0:5432 or 127.0.0.1:5432?
# 127.0.0.1 means it only accepts connections from localhost
# — unreachable from other containers even on the same network

# ── Step 5: Are they on the same network? ────────────────────
docker network inspect myapp_internal
docker network inspect myapp_internal \
  --format '{{range .Containers}}{{.Name}}: {{.IPv4Address}}{{"\n"}}{{end}}'

# ── Step 6: Capture traffic to see what's actually happening ─
sudo nsenter -t $(docker inspect db --format '{{.State.Pid}}') --net -- \
  tcpdump -i eth0 -n -A port 5432
# Gotcha 1: Service on wrong network
docker network connect myapp_internal mycontainer # add to network
docker network disconnect bridge mycontainer # remove from wrong network
# Gotcha 2: Published port bound to 0.0.0.0 (exposed to all interfaces)
# Dangerous on cloud VMs — bind to loopback instead
docker run -p 5432:5432 postgres # exposes to world
docker run -p 127.0.0.1:5432:5432 postgres # loopback only
# Gotcha 3: iptables rules stale after Docker restart
sudo iptables -t nat -L DOCKER -n --line-numbers # check current rules
sudo systemctl restart docker # usually fixes stale rules
# Gotcha 4: Host networking — container uses host's network stack directly
docker run --network host myapp # no isolation — shares host ports
# Gotcha 5: Inspect MTU mismatches (can cause silent packet drops)
docker exec mycontainer ip link show eth0 | grep mtu
ip link show docker0 | grep mtu # should matchPerformance & resource debugging
# Live stats for all running containers
docker stats

# Custom format — cleaner output
docker stats --format \
  "table {{.Name}}\t{{.CPUPerc}}\t{{.MemUsage}}\t{{.MemPerc}}\t{{.NetIO}}\t{{.BlockIO}}"

# One-shot snapshot (no streaming) — useful in scripts
docker stats --no-stream --format "{{.Name}}: {{.CPUPerc}} CPU, {{.MemUsage}}"

# Watch a specific container
docker stats mycontainer

# Export stats to CSV for analysis
while true; do
  docker stats --no-stream --format "{{.Name}},{{.CPUPerc}},{{.MemUsage}}"
  sleep 5
done >> container-stats.csv
# Find the container's cgroup
CGROUP=$(docker inspect mycontainer --format '{{.Id}}' | head -c 12)
# Real-time CPU throttling — is the container being rate-limited?
cat /sys/fs/cgroup/system.slice/docker-$CGROUP*.scope/cpu.stat
# Look for: throttled_usec — time spent throttled due to CPU quota
# High throttled_usec = container hitting its CPU limit constantly
# Memory pressure stats
cat /sys/fs/cgroup/system.slice/docker-$CGROUP*.scope/memory.stat
# Look for: pgmajfault (major page faults) — indicates memory pressure
# I/O stats
cat /sys/fs/cgroup/system.slice/docker-$CGROUP*.scope/io.stat
# CPU pressure — kernel's own assessment of CPU saturation
cat /sys/fs/cgroup/system.slice/docker-$CGROUP*.scope/cpu.pressure
# Process-level CPU in the container
docker exec mycontainer top -b -n 1 | head -20OOM kills — memory forensics
An OOM (Out of Memory) kill is when the Linux kernel's OOM killer terminates a process because the cgroup has exceeded its memory limit. Exit code 137 (128 + signal 9). The container dies with no warning in the logs because the kill comes from the kernel, not from the application.
# Confirm it was OOM — check the flag
docker inspect mycontainer --format 'OOMKilled: {{.State.OOMKilled}}'

# Check system-wide OOM events (requires host access)
sudo dmesg | grep -i "oom\|killed process" | tail -30

# dmesg output will show something like:
[ 8432.1] Memory cgroup out of memory: Kill process 12345 (node) score 987
[ 8432.1] Killed process 12345 (node) total-vm:1843200kB, anon-rss:524288kB

# Check kernel OOM log via journald
sudo journalctl -k --since -1h | grep -i "out of memory\|oom"

# Check current memory limit and usage
CGROUP=$(docker inspect mycontainer --format '{{.Id}}')
cat /sys/fs/cgroup/system.slice/docker-$CGROUP*.scope/memory.max
cat /sys/fs/cgroup/system.slice/docker-$CGROUP*.scope/memory.peak

# Instrument memory before it OOMs — watch usage live
watch -n 1 'docker stats --no-stream mycontainer'
Diagnosing a memory leak
If memory climbs steadily and never drops, it is a leak. If it spikes suddenly, it is a burst workload. Use memory.stat in cgroups to distinguish heap vs. page cache. Many "leaks" are actually just page cache the kernel fills unused memory with cache, which looks like a leak but is normal. Look at anon (anonymous) memory in memory.stat, not the total. Anon climbing = real leak.
docker events — the timeline of everything
docker events streams a real-time log of every action the Docker daemon takes container starts, stops, kills, health check state changes, network connects, volume mounts. It is the only way to answer "exactly when did this happen and in what order?"
# Stream all events
docker events

# Filter to a specific container
docker events --filter container=mycontainer

# Filter by event type
docker events --filter type=container --filter event=die
docker events --filter event=health_status  # health check changes only
docker events --filter event=oom            # OOM events only

# Events from the last hour, formatted as JSON
docker events --since 1h --format '{{json .}}' | jq

# Diagnose a restart loop — watch the pattern
docker events --filter container=mycontainer --filter event=start \
              --filter event=die --filter event=restart

# Typical restart loop output:
2024-01-15T14:22:01 container start  mycontainer
2024-01-15T14:22:03 container die    mycontainer (exitCode=1)
2024-01-15T14:22:08 container start  mycontainer  ← restart policy kicked in
2024-01-15T14:22:09 container die    mycontainer (exitCode=1)
# Pattern: starts immediately die → application crash, check logs
# Pattern: starts, lives 30s, dies → health check failure or timeoutDebugging distroless & scratch images
Distroless and scratch images have no shell, no package manager, and often no basic utilities. You cannot docker exec bash into them. This is a security feature but it makes debugging harder. Here are three strategies, from least to most invasive.
# Attach a fully-tooled debug container to the target's namespaces
# Works on running production containers — no restart required
docker run -it --rm \
  --pid=container:mycontainer \
  --network=container:mycontainer \
  nicolaka/netshoot

# netshoot includes: tcpdump, curl, wget, dig, nmap, ss, ip,
# strace, ltrace, iperf3, mtr, drill, tshark, and 70+ more tools
# Add a debug target to your multi-stage Dockerfile
FROM gcr.io/distroless/static-debian12 AS production
COPY --from=builder /app/server /server
ENTRYPOINT ["/server"]
# Debug variant: same binary, but with a shell layer
FROM gcr.io/distroless/static-debian12:debug AS debug
COPY --from=builder /app/server /server
ENTRYPOINT ["/busybox/sh"] # distroless:debug includes busybox# Copy a statically compiled debug tool directly into the container
# Useful when you can't restart and need a specific tool
# Download a static binary (e.g. static curl or busybox)
wget https://busybox.net/downloads/binaries/1.35.0/busybox-x86_64 -O /tmp/busybox
chmod +x /tmp/busybox
# Copy it into the running container
docker cp /tmp/busybox mycontainer:/busybox
# Execute it via docker exec (no shell needed — exec can run binaries directly)
docker exec mycontainer /busybox sh # now you have a shell!
docker exec mycontainer /busybox wget -O- http://db:5432The war room checklist — production incident in progress
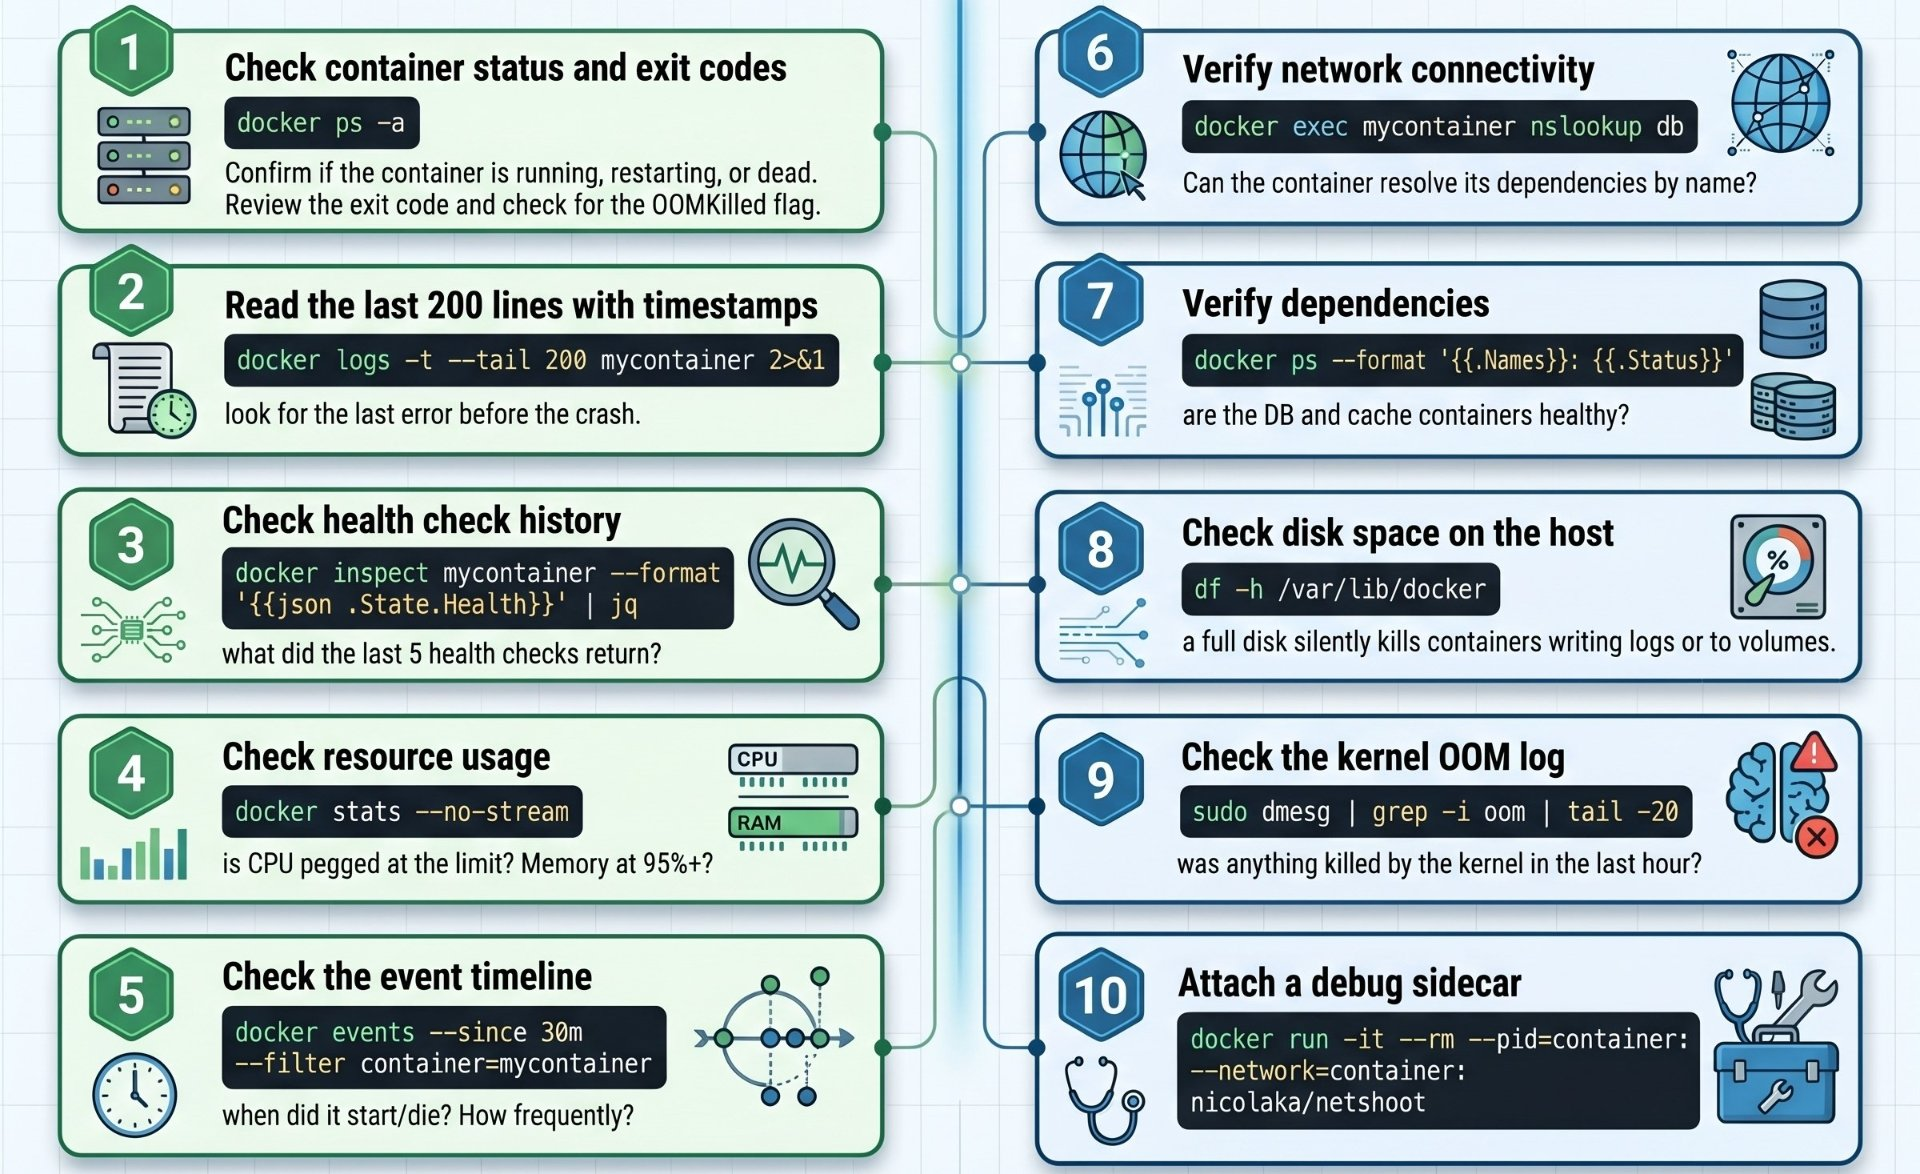
mething is broken in production right now. Work through this list in order do not skip steps.
# Run this and paste the output into your incident report
CONTAINER=mycontainer
echo "=== STATUS ==="         && docker inspect $CONTAINER --format 'Status={{.State.Status}} Exit={{.State.ExitCode}} OOM={{.State.OOMKilled}} Restarts={{.RestartCount}}'
echo "=== HEALTH ==="         && docker inspect $CONTAINER --format '{{json .State.Health}}' | jq -c '.Log[-3:]'
echo "=== RESOURCES ==="      && docker stats --no-stream $CONTAINER
echo "=== LAST 50 LOGS ==="   && docker logs --tail 50 -t $CONTAINER 2>&1
echo "=== LAST EVENTS ==="    && docker events --since 30m --filter container=$CONTAINER --format '{{.Time}} {{.Action}}' &
Author's Note
Chamath P.
DevOps Engineer
DevOps Engineer writing practical guides on Kubernetes, CI/CD, IaC, and SRE — based on real production experience.
This article was written with AI assistance. All technical claims and code examples have been personally verified before publishing.
Advertisements