SLIs, SLOs, and SLAs — The Reliability Contract
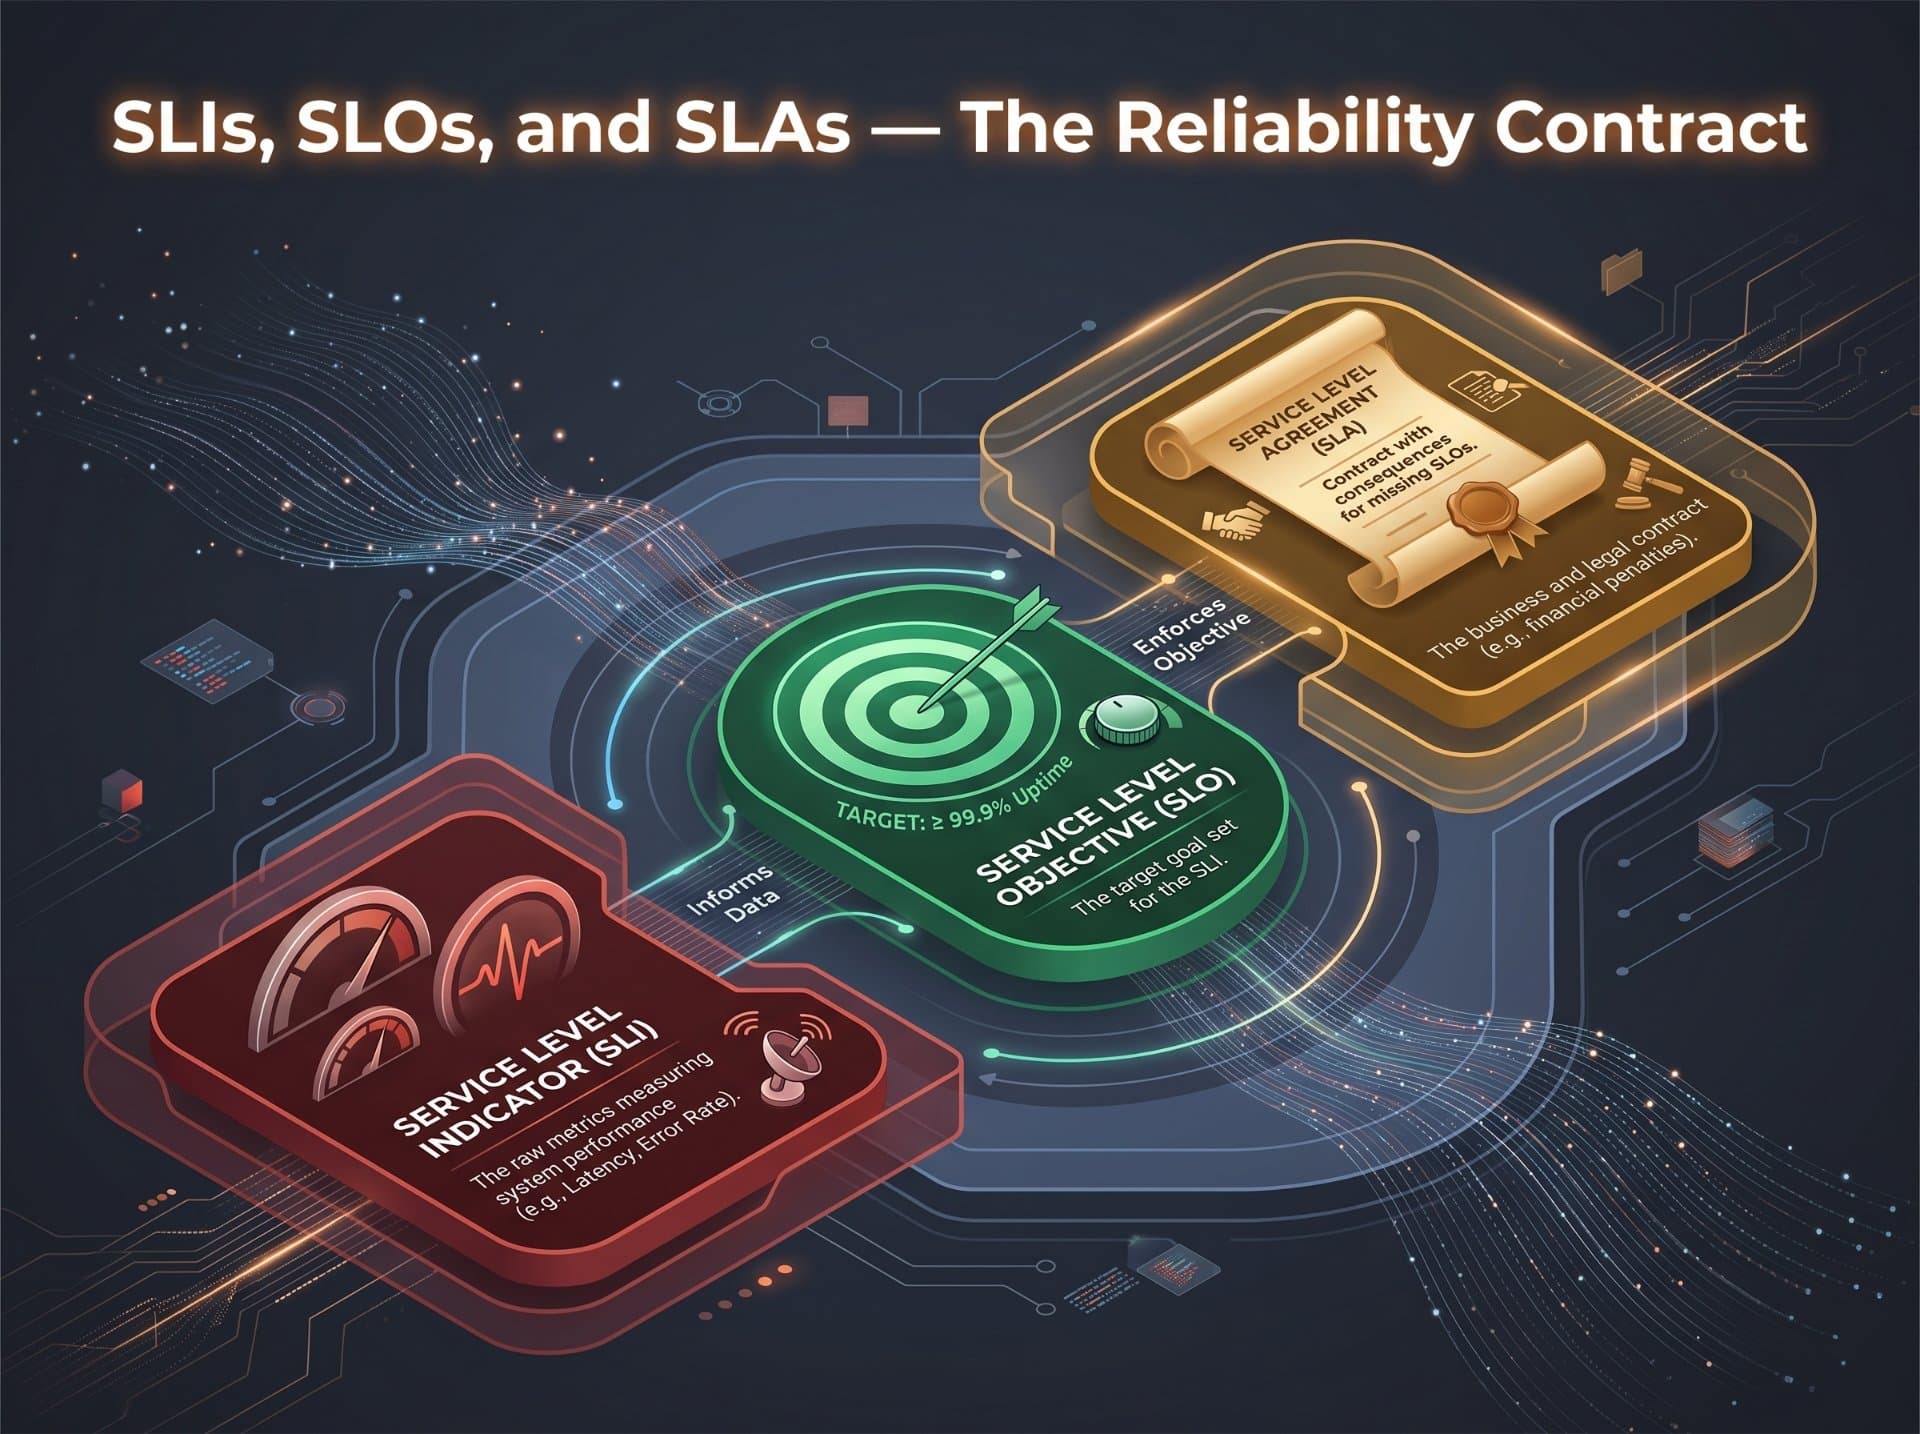
Three acronyms. One of the most misunderstood concepts in the industry. This article explains exactly what each one means, how they relate to each other, how to define them for real services, and the mistakes that make them useless in practice.

Advertisements
Why these three acronyms change everything
Before SRE introduced this framework, reliability was described in vague terms: "the system should be fast", "we aim for high availability", "we want users to have a good experience." These statements are not wrong they are just not engineering. You cannot measure them. You cannot alert on them. You cannot tell whether you have achieved them. And when something goes wrong, you cannot have a principled conversation about whether it was acceptable.
SLIs, SLOs, and SLAs replace that vagueness with precision. They turn "the system should be fast" into "99% of API requests must complete in under 200 milliseconds, measured over a 28-day rolling window." That sentence is measurable, alertable, falsifiable, and arguable. It is the difference between an aspiration and an engineering target.
The speed limit analogy
"Drive safely" is advice. "Do not exceed 60 mph on this road" is a rule. You can measure compliance with a rule. You can enforce a rule. You can argue about whether a rule was broken. An SLO is the speed limit for your service's reliability. An SLI is the speedometer. An SLA is the legal consequence of repeatedly exceeding the limit.
The three concepts explained simply
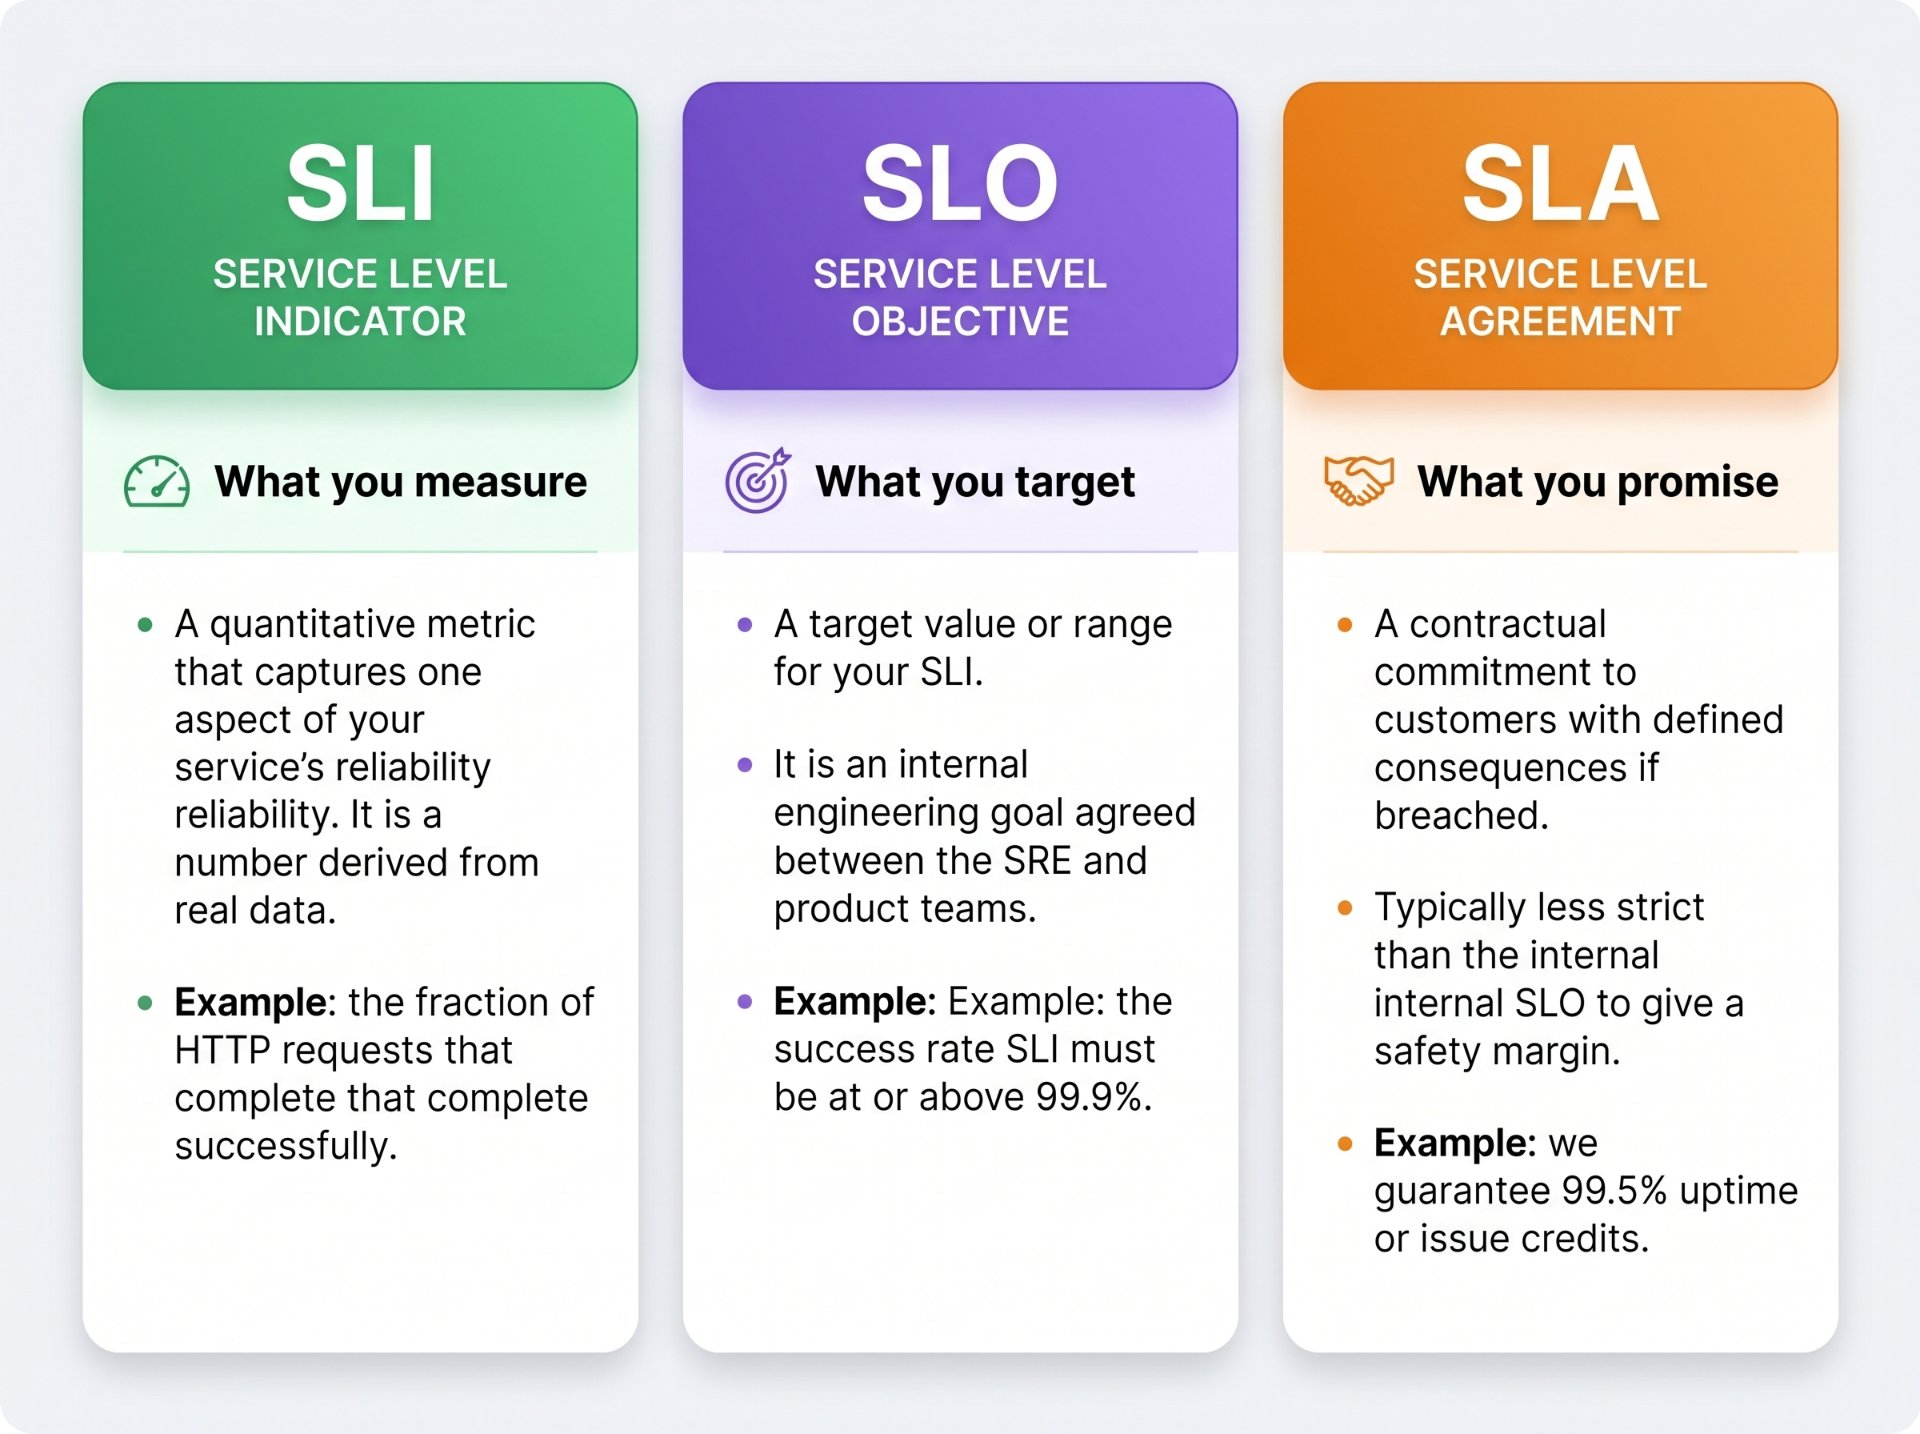
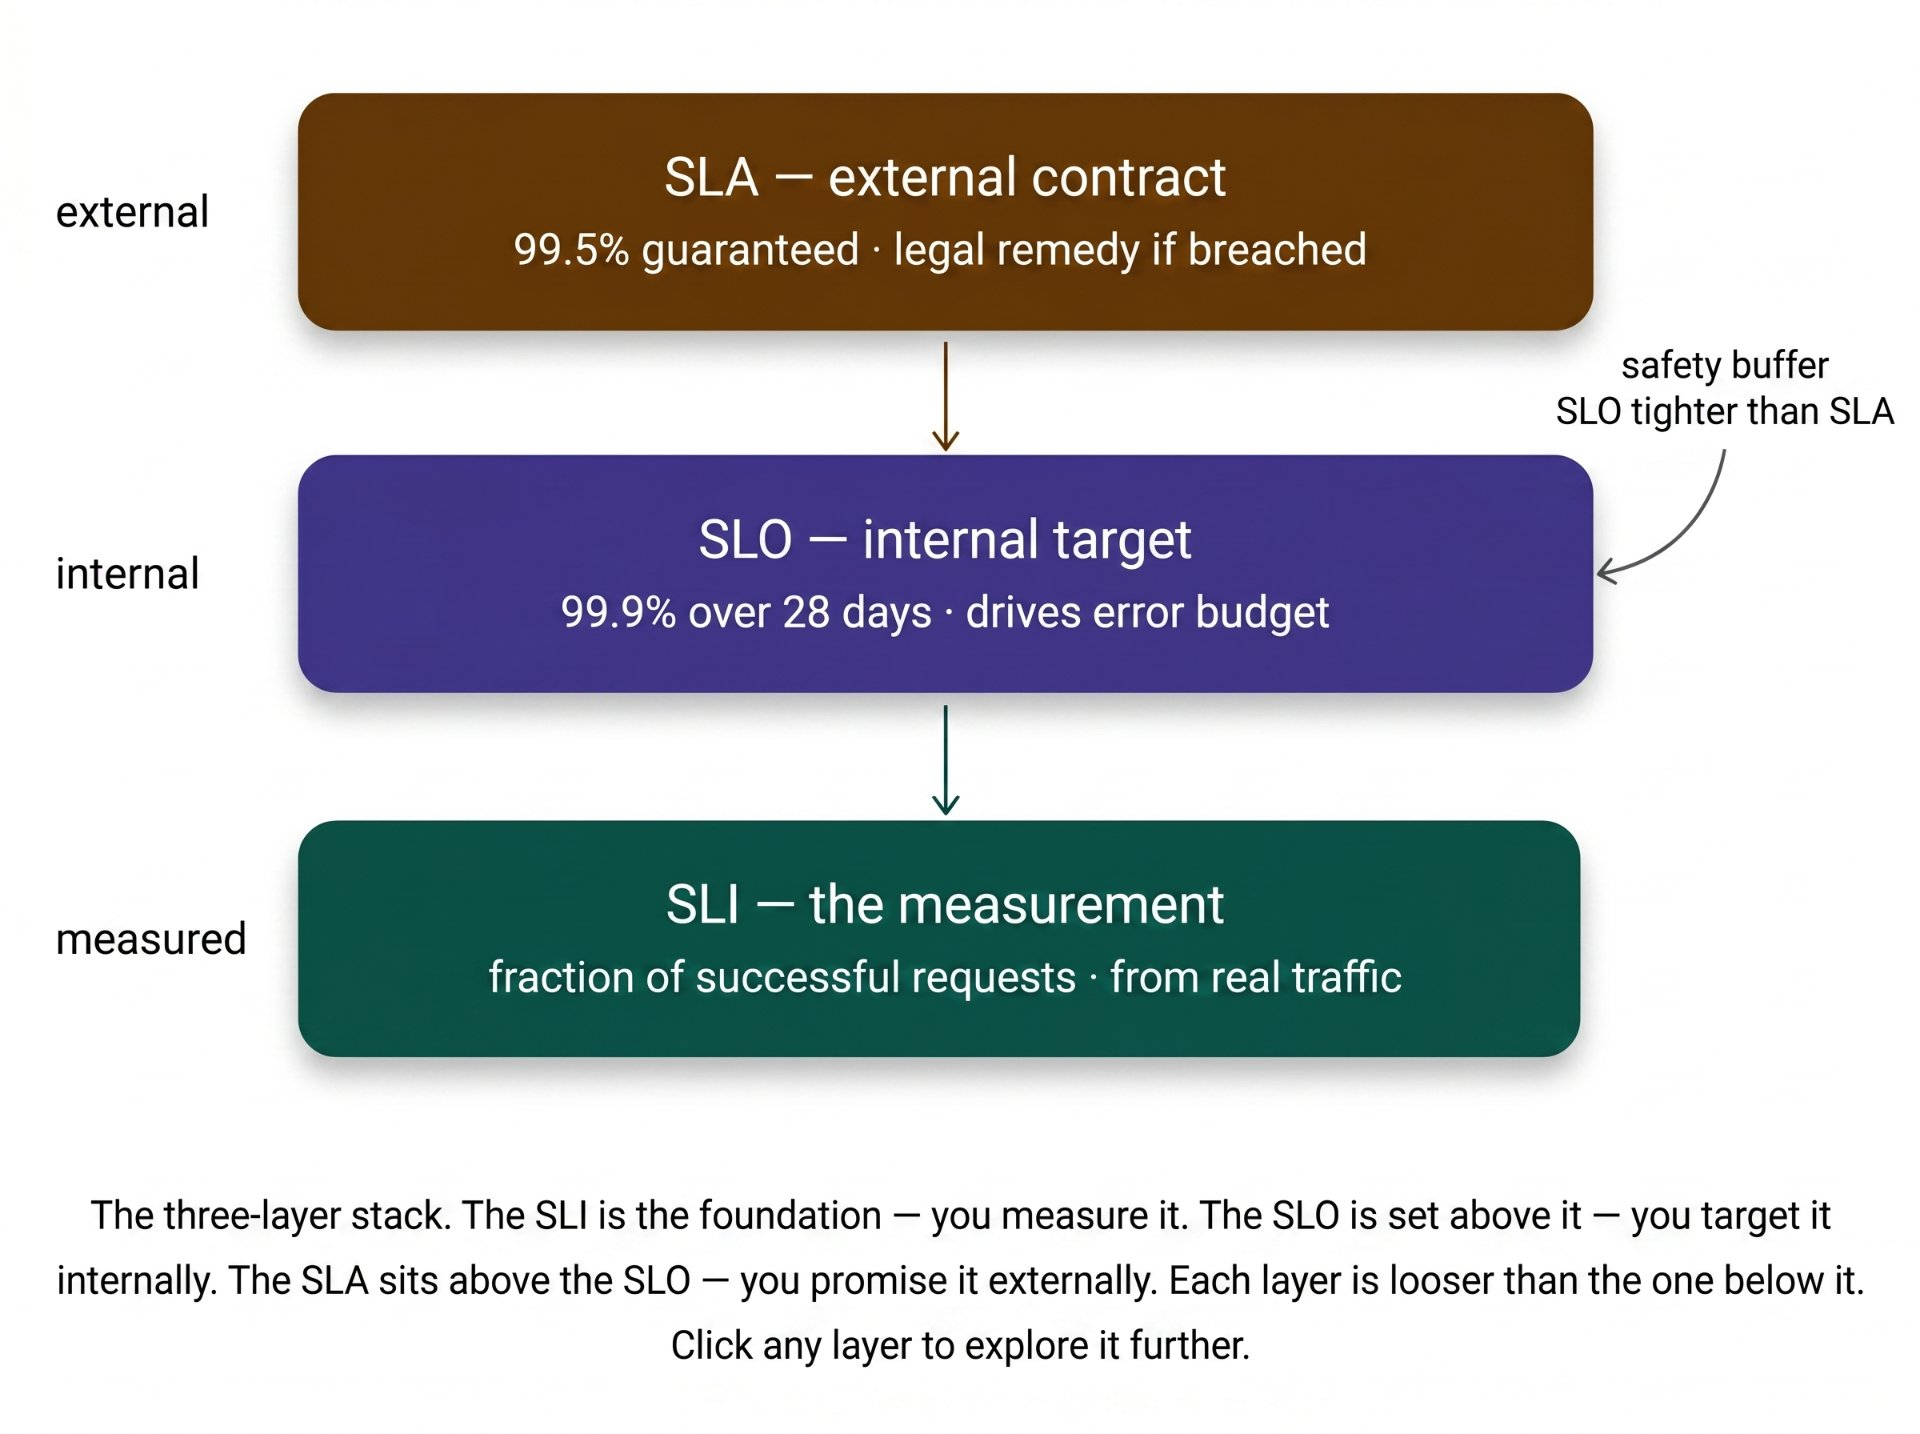
The one-sentence relationship: an SLI tells you what is happening, an SLO tells you what should happen, and an SLA tells you what happens to the business if you consistently fail to hit the SLO. SLI → SLO → SLA, in that order. You must have each before the next makes sense.
SLI — what you actually measure
A Service Level Indicator is a carefully chosen metric that tells you something meaningful about how well your service is serving its users. The key word is "carefully chosen." Not every metric is a good SLI most internal system metrics (CPU usage, memory pressure, garbage collection pauses) measure system health from the inside. SLIs measure service quality from the outside from the user's perspective.
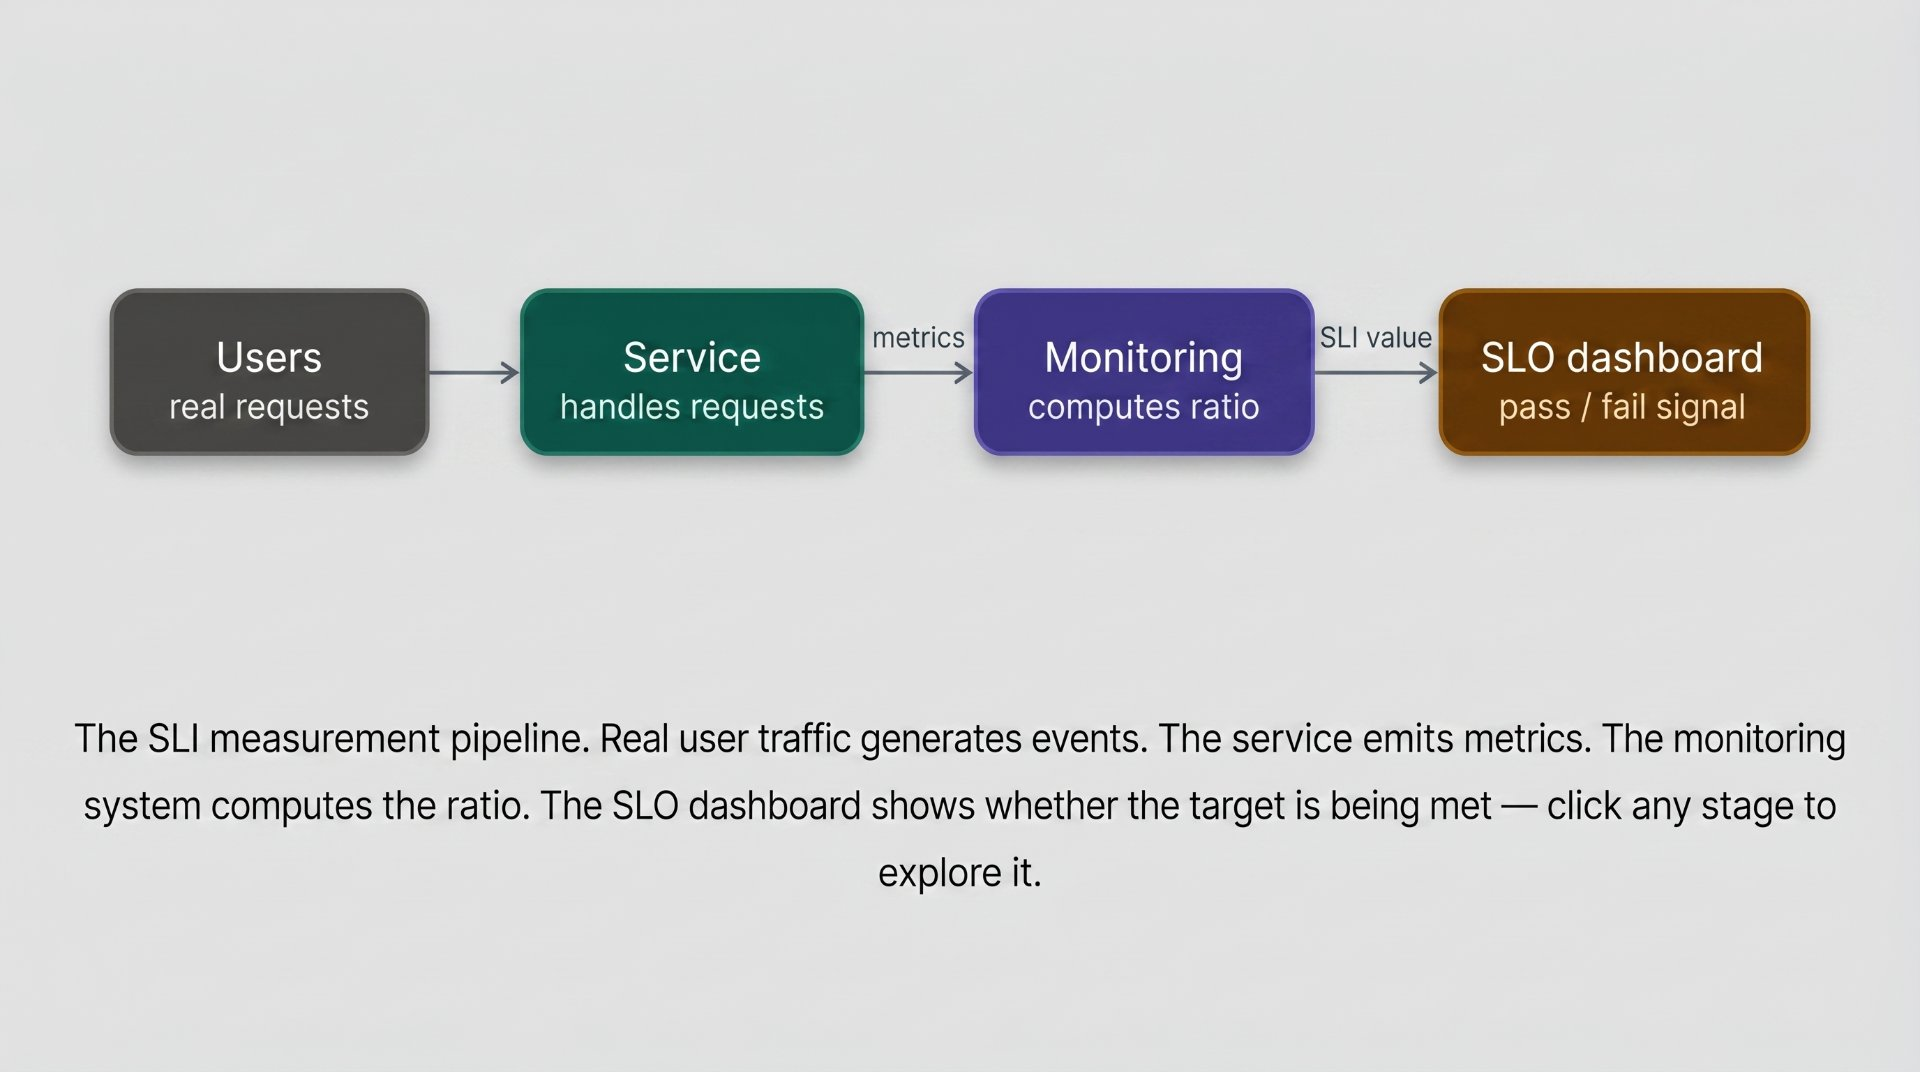
An SLI is always a ratio: good events divided by total events. This normalises for scale — whether you handle 100 requests or 100 million, the ratio tells you the same story. A raw count of errors is useless without context; an error rate (errors divided by total requests) is actionable.
THE SLI FORMULA
SLI = (count of good events) / (count of total events)e.g. availability SLI = successful_requests / total_requestse.g. latency SLI = requests_under_200ms / total_requests
Two important subtleties: first, you must define what counts as a "good" event. "Successful" is ambiguous does a 200 OK response that returns incorrect data count? Usually not. A good event is one that served the user correctly, which means you must define correctness. Second, you must define the measurement window. An SLI measured over the last minute behaves very differently from one measured over 28 days.
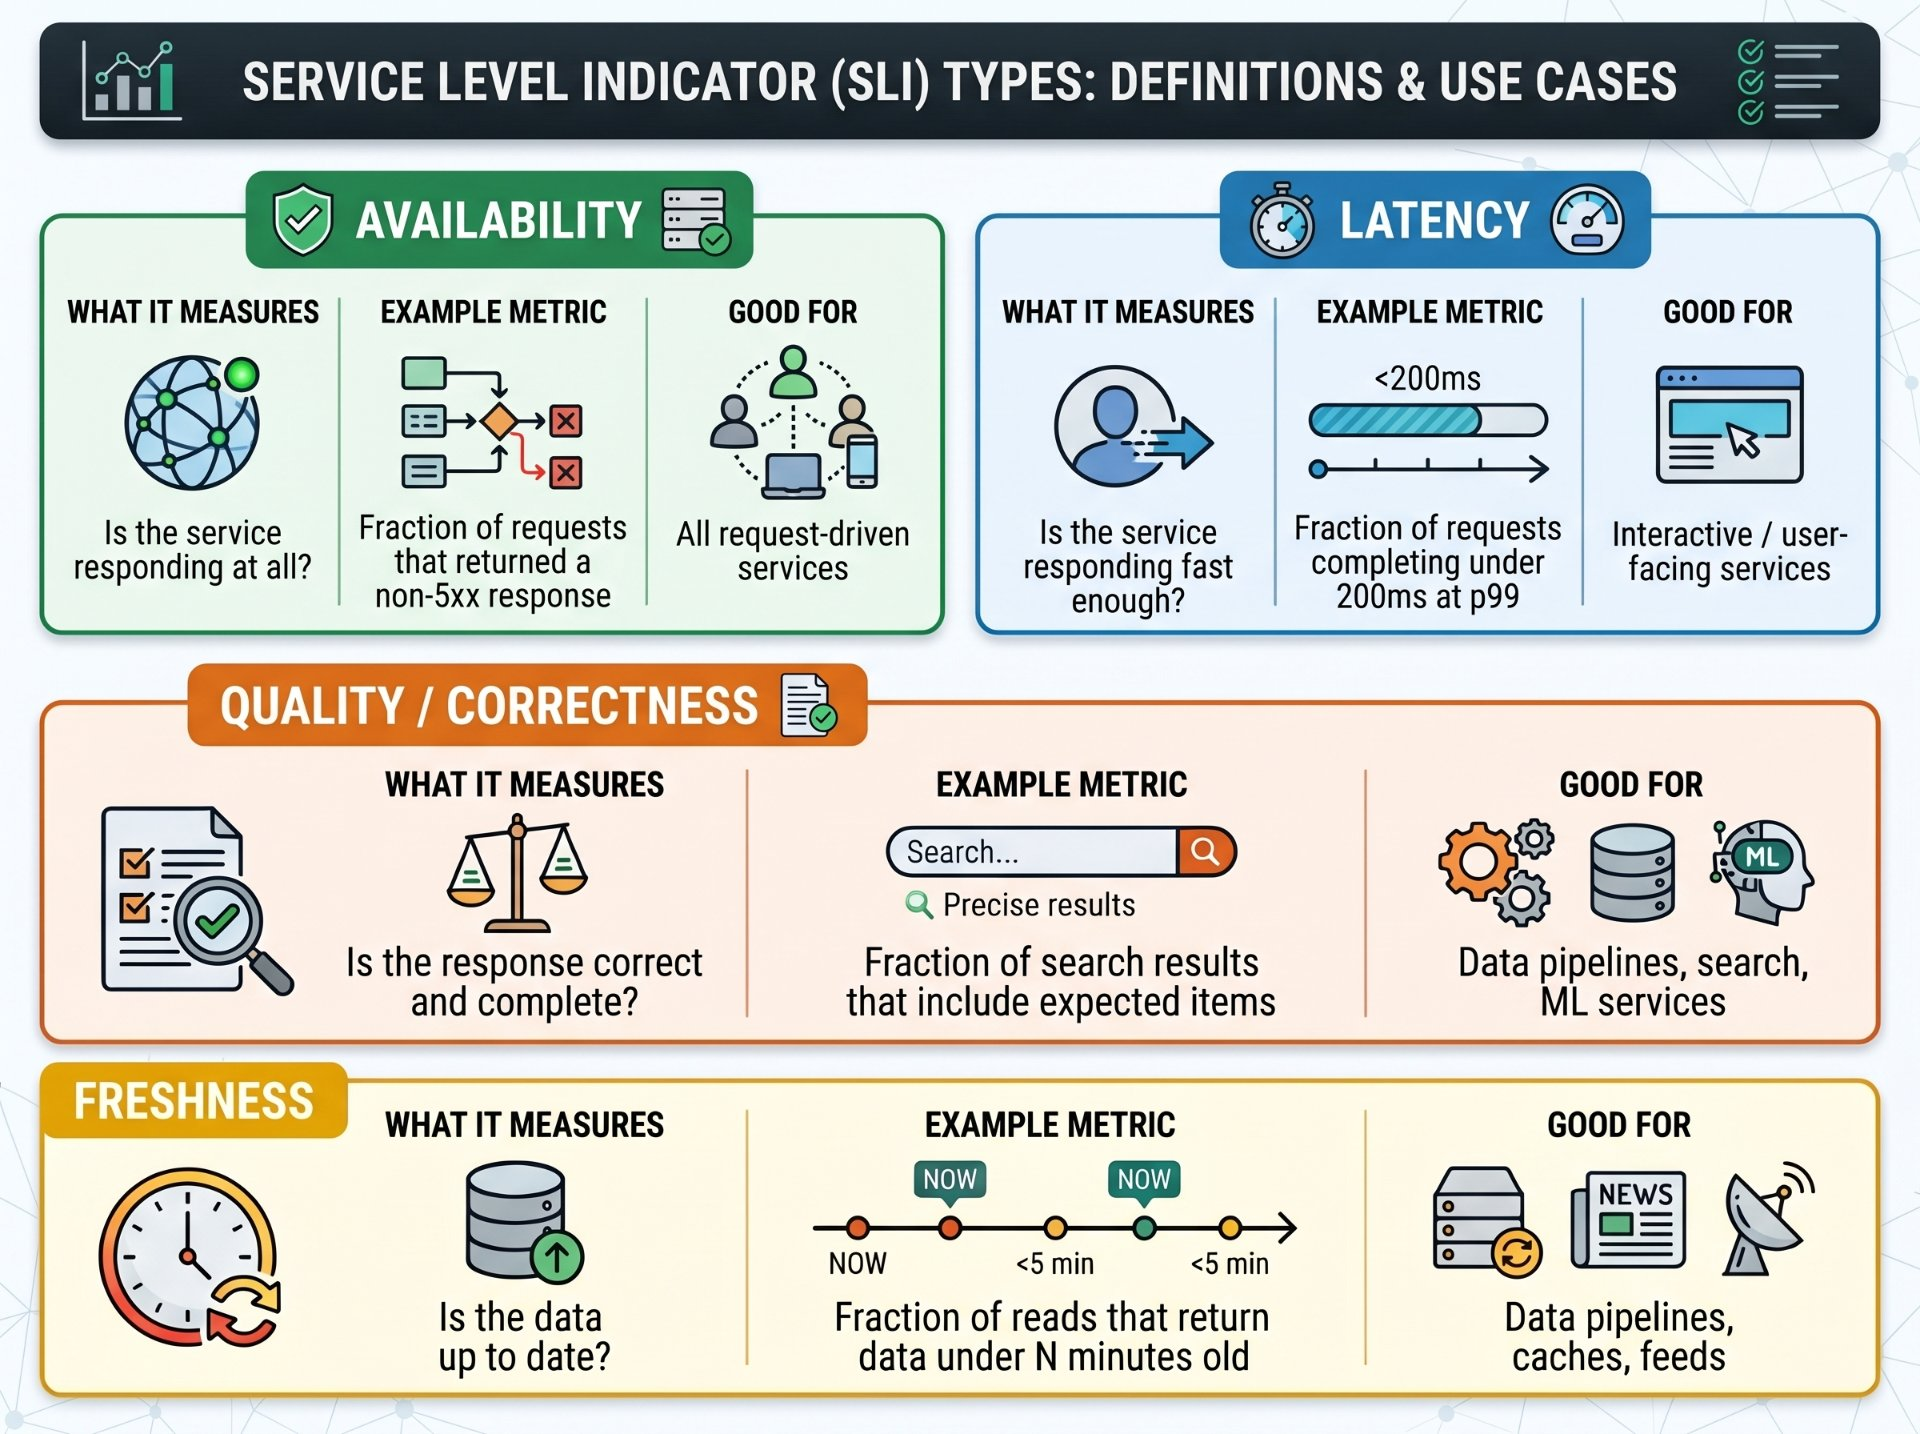
The four SLI categories
Most services can be characterised by four types of SLIs, originally defined in the SRE Book:
Always use percentiles, not averages
Averages lie. If 99% of your requests complete in 10ms and 1% complete in 10 seconds, your average might be a comfortable 110ms while 1 in every 100 users experiences a terrible experience. SLIs should use percentiles: p50, p95, p99, p99.9. The p99 latency tells you "99% of users experience a response faster than this." That is a user-centric measurement. An average is not.
SLO — the target that governs everything
A Service Level Objective is a target value for an SLI over a defined time window. It is the internal engineering commitment the threshold below which the team declares itself to be failing its users. SLOs are not aspirations; they are commitments that should change team behaviour when they are violated.
An SLO has three components: the SLI it is based on, the target value, and the time window. All three are required. "We want 99.9% availability" is incomplete 99.9% over what period? Over the last hour? The last year? A 99.9% monthly SLO allows 43 minutes of downtime per month. A 99.9% annual SLO allows 8.7 hours. These are very different commitments.
SLO ANATOMY — THREE REQUIRED COMPONENTS
SLO = [SLI] [target value] over [time window]e.g. "availability SLI >= 99.9% over a rolling 28-day window"e.g. "p99 latency SLI >= 95% of requests under 200ms over 28 days"
The time window question
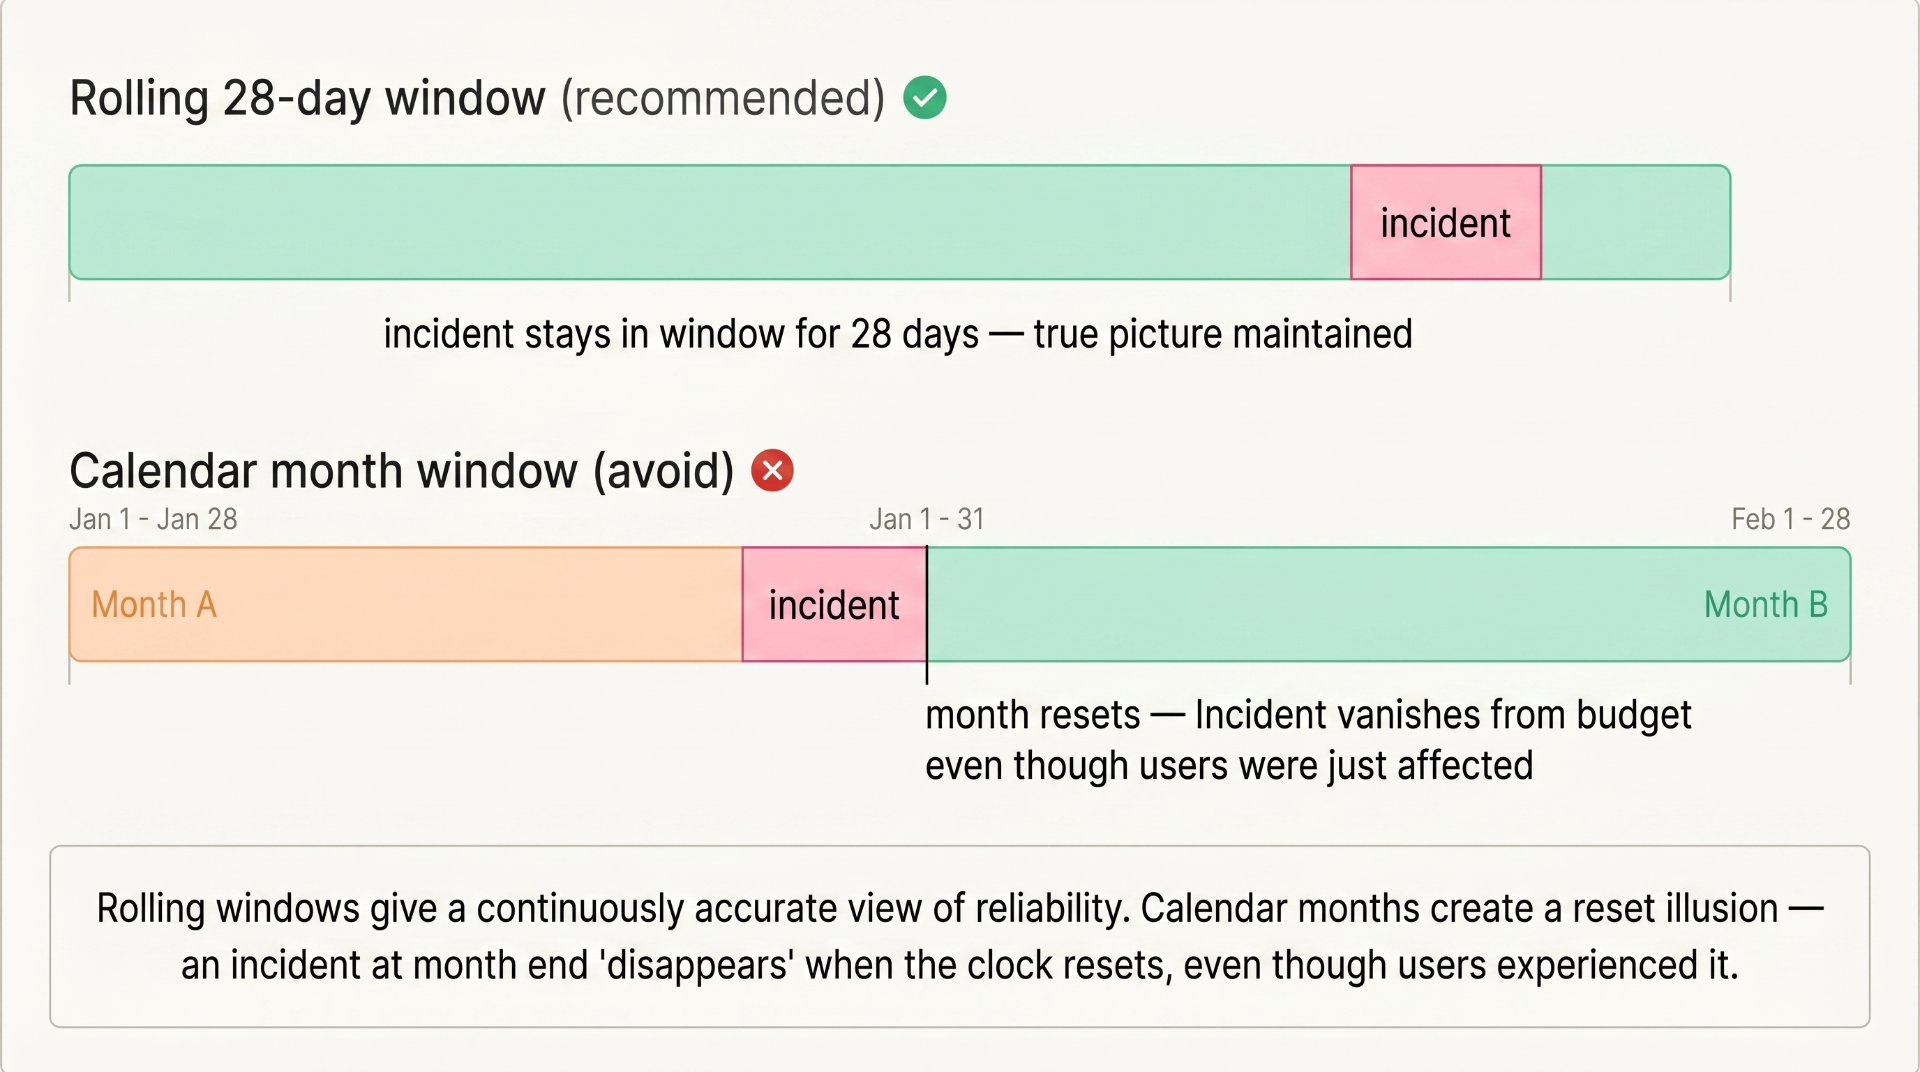
The most common time window choices are rolling 28 days (or 30 days), rolling 7 days, or calendar month. Rolling windows are preferred for SLOs because they provide a continuous, always-current view of reliability you always know whether you are within budget right now. Calendar months create a reset effect: you could have a terrible last week of the month and then reset to a clean slate on the first.
Rolling 28 days is the most widely used window in production SRE because it aligns roughly with four calendar weeks, is long enough to smooth out short-term noise, and short enough to recover from within a reasonable timeframe if you invest in reliability improvements.
SLA — the external promise with consequences
A Service Level Agreement is a contract typically between a service provider and a paying customer that defines the reliability standards the provider commits to and the remedies (usually service credits or refunds) that apply if those standards are not met. SLAs are commercial documents as much as technical ones. They are written by lawyers as well as engineers.
The critical relationship between SLOs and SLAs: your SLA target must always be less strict than your internal SLO. If your internal SLO is 99.9%, your SLA might commit to 99.5%. This safety margin serves two purposes: it gives you time to detect and respond to an SLO violation before it becomes an SLA breach, and it prevents the absurd situation where your internal engineering target is identical to your external legal commitment leaving zero room for error.
The restaurant analogy
A restaurant's internal kitchen standard might be "all orders ready within 12 minutes." The menu might say "meals served within 20 minutes or your next visit is free." The internal target is tighter kitchen staff aim for 12. The public promise is looser 20 minutes giving a buffer. If the kitchen misses 12 minutes on a table, the manager knows before the customer's 20-minute guarantee is at risk. The SLO (12 minutes) is tighter than the SLA (20 minutes). This is always the correct relationship.
What makes a bad SLA
Many companies publish SLAs that sound impressive but are practically unenforceable. "99.99% monthly uptime" sounds great until you calculate it allows only 4.3 minutes of downtime per month with no definition of what "downtime" means, no measurement methodology, and a claims process that requires the customer to file a ticket within 72 hours of an incident. A good SLA defines the SLI it is based on, the measurement window, the measurement methodology, how customers claim remedies, and what the remedies actually are.
How the three connect — the complete picture
Now that each term is clear, let's see how they stack into a single coherent framework from raw measurement all the way to customer commitment.
Choosing the right SLIs — measure what users experience
The most important principle when choosing SLIs: measure what the user experiences, not what the system reports about itself. CPU utilisation is not an SLI. Database connection pool usage is not an SLI. These are internal signals. The user does not care about your CPU they care whether their request succeeded and how fast it came back.
A useful test for any proposed SLI: "If this metric were perfect, would users definitely be happy?" If the answer is no if you could imagine a scenario where the metric is green but users are miserable it is not the right SLI. If a perfect metric guarantees a good user experience, you are measuring the right thing.
BAD SLI VS GOOD SLI — THE TEST
Bad SLI:
database CPU < 80%– CPU could be fine while all queries time outGood SLI:
fraction of DB queries returning in under 100ms– directly measures what the application (and therefore user) experiences
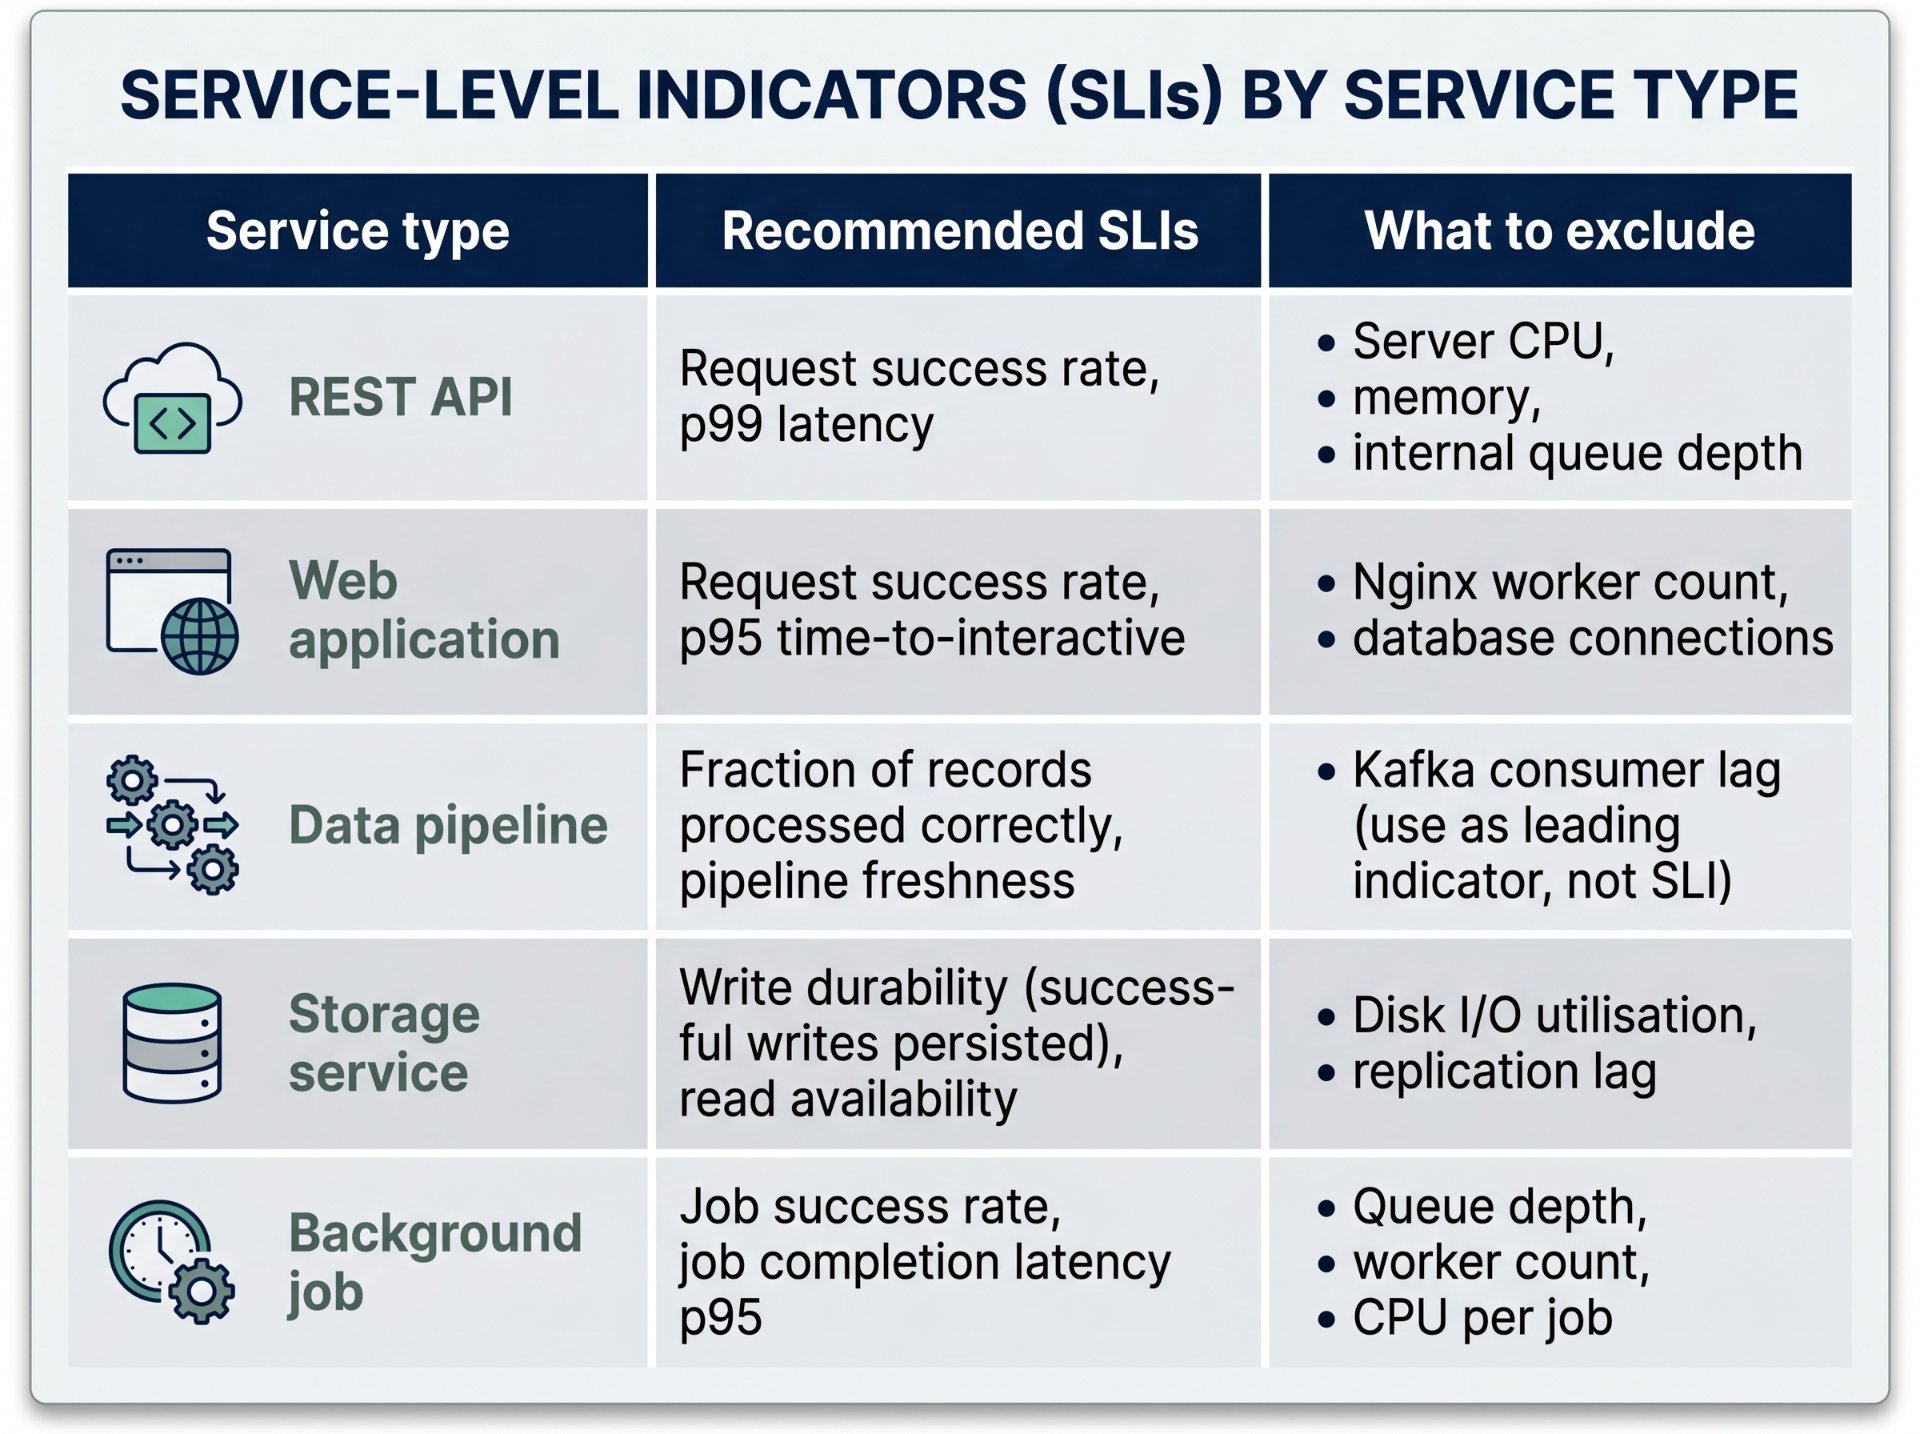
Practical SLI selection by service type
Setting SLO targets — the art of calibrating ambition
The most common SLO mistake is choosing a target based on what sounds impressive rather than what the service actually delivers. Setting an SLO of 99.99% when your service historically runs at 99.5% is not aspirational it is self-deception. Your SLO should reflect your current capability and your users' actual needs, with a realistic improvement trajectory built in over time.
The four-step process for setting an initial SLO
Step 1: measure your current performance. Before setting any target, measure what your service is actually delivering today. Do this over 90 days minimum to understand the baseline and seasonal patterns. Step 2: understand what your users need. A payment processing service needs far higher availability than an internal analytics dashboard. The target should reflect the real impact of failure on users. Step 3: set the target slightly below your current performance. Not so low that there is no incentive to improve, but low enough that you are not constantly violating it. Start at roughly the 5th percentile of your last 90 days' performance. Step 4: build in a ratchet. Commit to reviewing SLOs quarterly and tightening them as the service improves. This creates a continuous improvement trajectory without the demoralising effect of setting targets you cannot meet.
100% is the wrong target — always
If your SLO is 100% availability, you cannot deploy anything. Every deployment carries risk, and a 100% SLO means any deployment that causes even a brief blip is a violation. This creates perverse incentives: the safest strategy is to deploy nothing, which means the product never improves. Setting a 100% SLO is a sign that the organisation has not yet understood what SLOs are for. The appropriate target is the highest reliability level that allows your product to continue evolving.
Real-world examples — worked end-to-end
Example 1: E-commerce checkout API
COMPLETE SLI → SLO → SLA DEFINITION
SLI (availability):
successful_checkout_requests / total_checkout_requests– where "successful" = HTTP 2xx with a valid order confirmation returnedSLI (latency):
checkout_requests_under_2s / total_checkout_requests– measured at p99: 99% of requests must complete in under 2 secondsSLO (availability):
availability SLI >= 99.95% over rolling 28 days– error budget: 21.6 minutes of downtime per monthSLO (latency):
latency SLI >= 99% over rolling 28 days– 1% of requests may exceed 2s; more than that triggers reliability workSLA:
99.9% monthly availability· 10% credit if breached – 0.05% buffer between SLO (99.95%) and SLA (99.9%) for safety
Example 2: Internal analytics dashboard
LOWER STAKES = LOOSER TARGETS
SLI:
dashboard_load_success / total_dashboard_loads– "success" = dashboard renders within 5 seconds with valid dataSLO:
SLI >= 99.0% over rolling 28 days– 7.2 hours of failure time per month is acceptable for internal toolingNo SLA – internal service, no contractual obligation to users – business impact of failure is measured in inconvenience, not revenue
Notice how the targets differ dramatically between the two examples. A checkout API failure costs the business money in real time high availability target, latency SLO, commercial SLA. An internal dashboard failure means analysts have to wait or use another tool relaxed SLO, no SLA. The targets reflect the real cost of failure to the business and its users.
The most common SLI/SLO/SLA mistakes
Mistake 1 — measuring uptime instead of user experience
"The server is up" is not the same as "users are being served." A server that is running but returning 500 errors to all requests is "up" by naive monitoring but failing every user. Your SLIs must measure the user's experience of the service, not the server's self-reported health.
Mistake 2 — setting SLOs nobody looks at
An SLO that lives in a document and is never checked, never alerts, and never changes team behaviour is not an SLO — it is decoration. SLOs only work when they are wired to alerting (SLO burn rate alerts fire when you are burning budget too fast), visible (there is a dashboard everyone can see), and enforced (a violated SLO changes the team's priorities).
Mistake 3 — too many SLOs
Start with one or two SLOs per service — availability and latency. A team managing fifteen SLOs simultaneously cannot give any of them meaningful attention. Add SLOs incrementally as the team matures and as specific reliability problems become clear. More SLOs is not always better reliability.
Mistake 4 — making the SLO identical to the SLA
If your internal SLO is 99.9% and your SLA is also 99.9%, there is no warning before an SLA breach. The first signal that you have a problem is that you have already violated your customer commitment. Always set the SLO tighter than the SLA. The gap is your early warning system.
Mistake 5 — never revising SLOs
SLOs are not permanent. As your service matures and your users' expectations evolve, your SLOs should evolve too. Review them quarterly. Tighten them when your service consistently beats them. Relax them if they are consistently causing unnecessary firefighting without corresponding user impact. An SLO that was right eighteen months ago may be wrong today.
Author's Note
Chamath P.
DevOps Engineer
DevOps Engineer writing practical guides on Kubernetes, CI/CD, IaC, and SRE — based on real production experience.
This article was written with AI assistance. All technical claims and code examples have been personally verified before publishing.
Advertisements